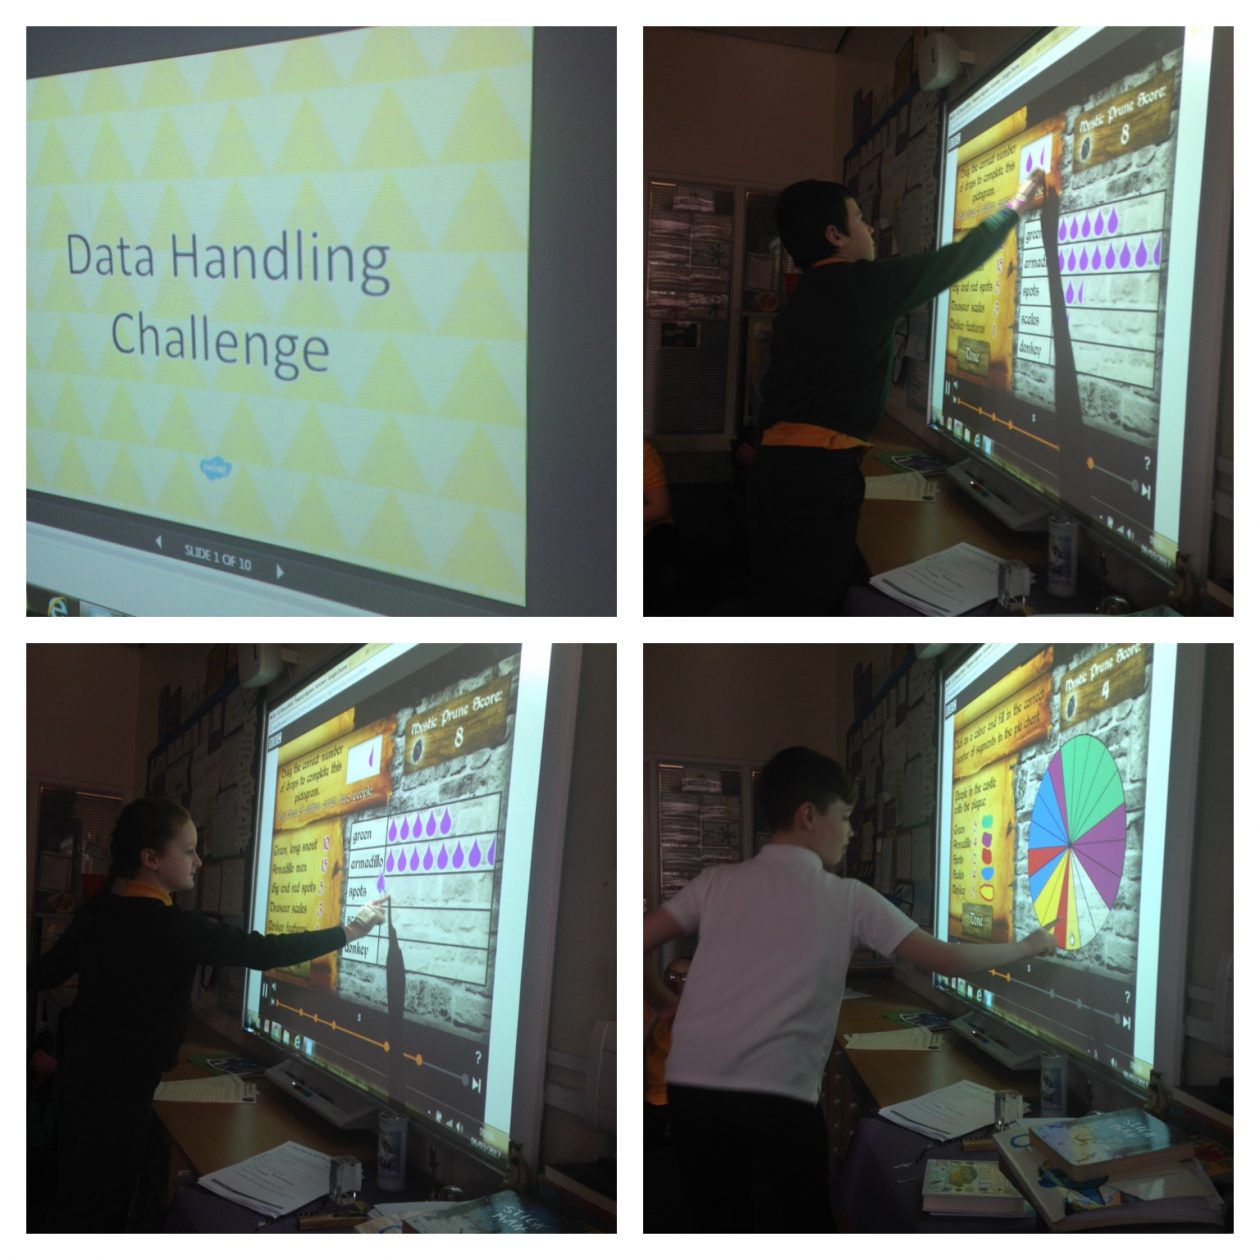
This week Primary 6 have been working in handling data in a variety of ways. We used, bar graphs, pictograms, line graphs, pie charts, Venn diagrams and ,Carroll Diagrams to record data that we had obtained from class mates and other sources. We realised that the way you display information can be misleading.