- Scripting languages – JavaScript is used to make the webpages interactive, eg display date/time
- Mark-up languages – HTML used to code the webpages, styles can be used.

Remember there is a class assessment on Thursday.
As discussed in class I have attached the presentations of the three past papers that are available.
As discussed in class I have attached the presentations of the three past papers that are available.

These are the final SCHOLAR online sessions for this academic year focusing on exam preparation.
Full details can be found on the SCHOLAR website: http://scholar.hw.ac.uk/Resources/Live_Online_Sessions/
The Tutors will also be online to answer student questions on the discussion boards, details can be found: http://scholar.hw.ac.uk/Resources/Ask_a_Tutor.html
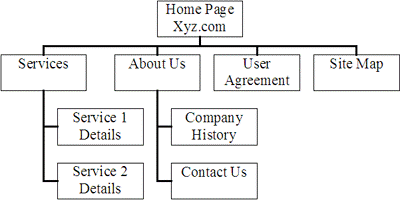
The structure of a website can be planned using a site map. This will show how the pages in the site link together, usually in a hierarchical structure.
The layout of individual pages can be planned using wireframes. These will show how text, graphics, links, etc will fit together on the page.
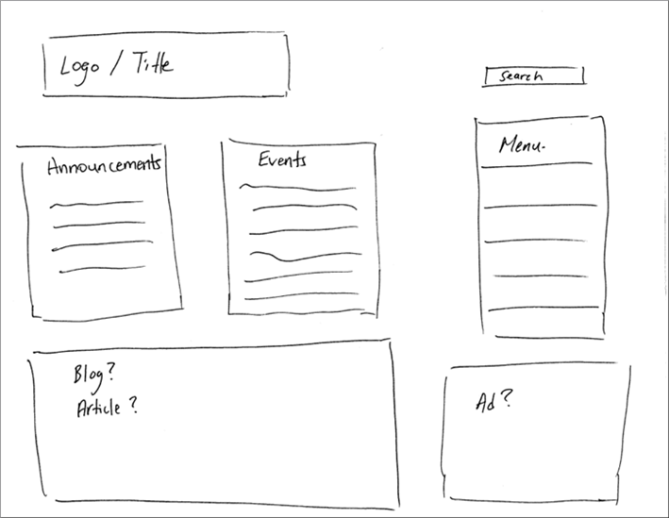
You may also consider noting formatting information, such as colours and fonts to be used.
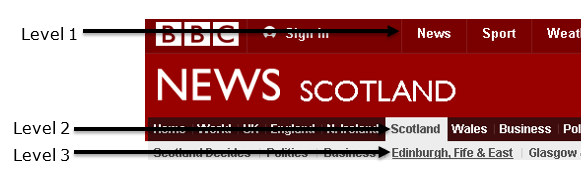
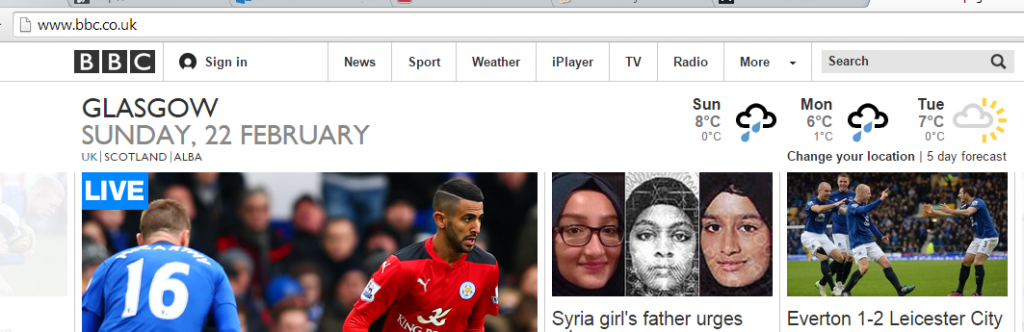
For example, the BBC website, allows you to choose a category, then another category within that, then another category within that, and so on.
HTML is a language used to define the content of a webpage, using a variety of tags.
Some more advanced HTML tags you should know:
| Tag | Notes | Example |
| <title> |
|
<title>
ACME Corporation home page </title> |
| <meta> |
|
Example 1
<meta name=”description” content=”ACME Corporation – Unlikely contraptions for all your needs”>
Example 2 <meta name=”keywords” content=”ACME, inventions, traps, contraptions”> |
| <style> |
|
<style> p{margin-left:20px;} body{ background-image:url(“background.gif”); } |
| <script> |
|
Example 1
<script>
Example 2 <script src=”js/lightbox.js”> </script> |
| <button> |
|
<button type=”button”>Click Me!</button> |
CSS is a language used to define the look and formatting of HTML documents.
CSS can be included within an HTML document, but it is preferable to link the HTML to a separate CSS file.
Using a separate CSS to define the formatting of HTML documents can help to give a consistent look across a website, save time and create more efficient code.
The look of all pages in a site can be changed by editing only the CSS file.
CSS can be used to provide different style rules depending on the type of device being used to view the webpage.
The rules of cascading stylesheets state that:
| body { background-color:#d0e4fe; } h1 { color:orange; font-weight:bold; } p { font-family:”Times New Roman”; font-size:20px; } |
This CSS sets the background colour for the body of the page, the colour and style of any text within <h1> tags, and the font and size of any text within <p>.
Any HTML file which is to use this formatting would simply include a line like this in the <head> section:
<link rel=”stylesheet” type=”text/css” href=”mystyle.css”>
Where “mystyle.css” is replaced with the name of the CSS file. |
A static webpage looks exactly the same every time it is accessed, the content does not change.
Dynamic webpages can contain different content depending on the conditions in which they are accessed, meaning that users can be presented with a page relating specifically to their needs.
Database-driven pages are the most common example of dynamic pages. If information changes in a database which the page accesses, then the content of the page will change to reflect this. For example, online shopping, banking, buying tickets, etc.
Interactive webpages offer a more immersive experience, allowing the user’s actions to affect the content. Creating interactive pages usually involves the use of JavaScript or Flash.
Including sections of program code in your website, to help make it more dynamic or interactive, is called scripting.
Appropriate use of compression can reduce the load times of webpages.
The webpage itself can be compressed, reducing the amount of data which has to be sent to the client computer. The browser will decompress the page before displaying it.
SEO is the process of improving the ranking of your webpage in search engine results, in order to increase traffic.
Some SEO techniques include:
Search engines and web crawlers
Optimisation of code
Load times of webpages affect traffic. By making code more efficient, file sizes, and therefore load times, can be reduced.
Some techniques include:
Accessibility
Web accessibility means making sure that all users can easily access and navigate your website.
Some ways in which accessibility can be improved include:
Usability
Usability refers to how easy your website is to use.
Some ways in which usability can be improved include:
Beta testing
Beta testers carry out testing on the final website before it goes live.
Beta testers could be anybody not involved in the development of the site, such as potential customers.
The purpose of beta testing is to identify any problems that occur in normal use.
Usability testing
Usability testing involves testing how easy the website is to use.
Eye-tracking
Think aloud
Horizontal Pixels = image width x resolution(DPI)
Vertical Pixels = image height x resolution(DPI)
Number of pixels = Horizontal Pixels x Vertical Pixels
File Size = Number of pixels x colour depth (in bits)
Example 1
This is enlarged but is 1 inch by 1 inch.
In that case there are 72 x 1 x 72 x 1 = 5184 pixels
Example 2
Bitmap with a resolution of 600×600 pixels in 8 bit colour.
Storage requirements
600 x 600 x 1 bytes = 360000
It is 1 byte as it is 8 bits per pixel
360000/1024 = 351.6 kilobytes
Example 3
Calculate the number of pixels in 4 inch by 5 inch photograph scanned which has a resolution of 600 dots per inch.
Pixels = 4 x 600 x 5 x 600 = 7,200,000 bits
7,200,000 / 8 = 90000 bytes
90000 bytes / 1024 = 878.9 Kb
Vector Graphics
It is possible to edit each object separately, for example, change the shape, colour, size and position.
Even if an object in a vector graphic is quite large, it doesn’t need a lot of computer memory. Therefore the file size of a vector graphic is often very small.
Vector graphics are scalable when you resize them, they do not lose quality.
Need for compression – reduces the file size so that the web page loads more quickly. Reducing bit depth has the same impact. Quality of the image is affected.
For example, a whole webpage can be compressed, reducing the amount of data which has to be sent to the client computer and therefore reducing the load time. The browser will decompress the page before displaying it.
Individual media elements audio, graphics and video within the webpage could also be compressed in order to reduce the size further.
MP3 (.mp3) Lossy compression
To calculate the file size (in bits) of an uncompressed audio file the basic formula is:
sample frequency (Hz) x sample depth (bits) x length (seconds) x number of channels
Calculate the file size of a mono voice recording captured at 24KHz with a sample depth of 8 bits, lasting for 15 seconds.
24000 x 8 x 15 x 1 = 2880000 bits
2880000 / 8 = 360000 bytes
360000 / 1024 = 351.56 KB
JPEG (.jpg) Lossy compression
PNG (.png) Lossless compression
GIF (.gif) Lossless compression • Restricted to 8 bit colour.
RLE (Run Length Encoding) is a lossless compression algorithm.
LZW (Lempel Ziv Welch) is a lossless compression method which is more effective than RLE.
Indexed colour involves storing the actual RGB codes used by the image in a separate colour palette, in order to reduce file size. This can be used as a compression technique where the bit depth of the graphic is less than 24.
To calculate the file size (in bits) of a bitmap graphic file the basic formula is:
number of pixels in image x bit depth
Example 1
Calculate the file size of a 400 x 400 pixel graphic with a colour depth of 24.
400 x 400 = 160000 pixels in the image
160000 x 24 = 3840000 bits
3840000 / 8 = 480000 bytes
480000 / 1024 = 468.75 KB
Example 2
Calculate the file size of a 300 x 200 graphic with 256 colours.
256 colours means a colour depth of 8 (because 28 = 256)
300 x 200 = 60000 pixels in the image
60000 x 8 = 480000 bits
480000 / 8 = 60000 bytes
60000 / 1024 = 58.6 KB
Example 3
Calculate the file size of a 6’ x 5’ image, scanned at 200dpi, with 16 bit colour.
6 x 5 x 200 x 200 = 1200000 pixels in image
1200000 x 16 = 19200000 bits
19200000 / 8 = 2400000 bytes
2400000 / 1024 = 2343.75 KB
2343.75 / 1024 = 2.3 MB
MPEG (.mp4) Lossy compression
AVI (.avi) No compression built-in
To calculate the file size (in bits) of an uncompressed video file the basic formula is:
number of pixels in frame x bit depth x frame rate (fps) x length of video (in seconds)
A video is simply a series of bitmap images, so this rule simply multiplies the size of one image by the number of images in the video.
Calculate the file size of a 300 x 250 pixel video, using 16 bit colour, 30 frames per second and lasting 30 seconds.
300 x 250 = 75000 pixels
75000 x 16 = 1200000 bits for 1 image
1200000 x 30 = 36000000 bits for 1 second of video
36000000 x 30 = 1080000000 bits for entire video
/8 = 135000000 bytes
/1024 = 131835.94 KB
/1024 = 128.75 MB
Thank you to C O’Toole & A Madill from Braidhurst High School for allowing me to edit and publish this here.
A database is a collection of data stored in a structured, organised manner.
A flat file database has all data is contained in one file (a table or entity).
Data is organised into fields (columns or attributes) and records (rows or occurrences).
Basic field types include: text, numeric, date, time.
Other field types include:
Relational databases have two or more files linked together. Using linked tables reduces unnecessary duplication of data, therefore reducing the opportunity for error.
Good database design avoids data duplication by using linked tables where appropriate and reduces errors in data entry by using suitable validation techniques.
There are 3 types of relationships between tables in a relational database.
One-to-one (1:1)
One-to-many (1:M)
Many-to-many (M:M)
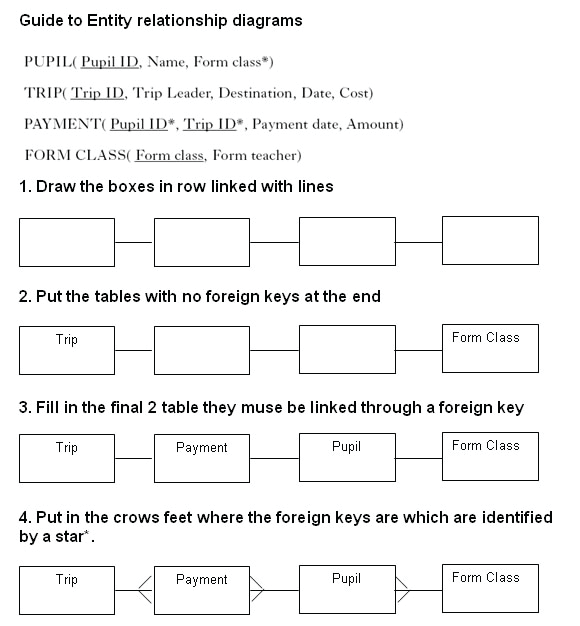
Entity Relationship Diagrams
Relationships can be represented graphically using an Entity-Relationship (ER) diagram.
There are many different notations for ER diagrams, we will use crow’s foot notation.
• The names of entities are written in boxes joined by straight lines.
• At the “many” end the line forks.
• At the “one” end the line it judt joins the box.
Example
Litters	(Litter ID
		Sire
		Dame
		Number in litter
		DOB)

Puppies	(Puppy ID
		Puppy name
		Sex
		Cost of puppy
Litter ID*)

Customers	(Customer name
		Address
Puppy ID*)

There are 3 tables in this database.

•	The Litters table has Litter ID as a primary key.
•	The Puppies table has Puppy ID as a primary key.
•	The Customers table uses Customer name and Address as a compound key.

•	Litter ID is a foreign key in the Puppies table.
This creates a one-to-many relationship between Litters and Puppies.

•	Puppy ID is a foreign key in the Customers table.
This creates a one-to-many relationship between Puppies and Customers.
Using appropriate validation reduces the chance of error when data is input.
Various validation techniques can be used to ensure data is appropriate:
Queries allows the user to find information in a database.
Users may perform simple queries looking at the contents of one field or complex queries looking at the contents of many fields.
When answering exam questions always state what data is being searched for and which field it should be in.
| Examples | |
| To find all the male pupils who are over 12 | SEARCH for “male” in the Gender field AND >12 in the Age field |
| To find all the people who live in Edinburgh or Glasgow | SEARCH for “Edinburgh” in the Town field OR “Glasgow” in the Town field |
| To find all the people born in the 1990s | SEARCH for >31/12/89 in the DOB field AND <1/1/00 in the DOB field |
Sorting puts database records in order based on the contents of particular fields.
| Examples | |
| Put the customers in alphabetical order | SORT on Surname field in Ascending order then the Forename field in Ascending order. |
| Find the tallest person in the database | SORT on Height field in Descending order then look at the first record in the list. |
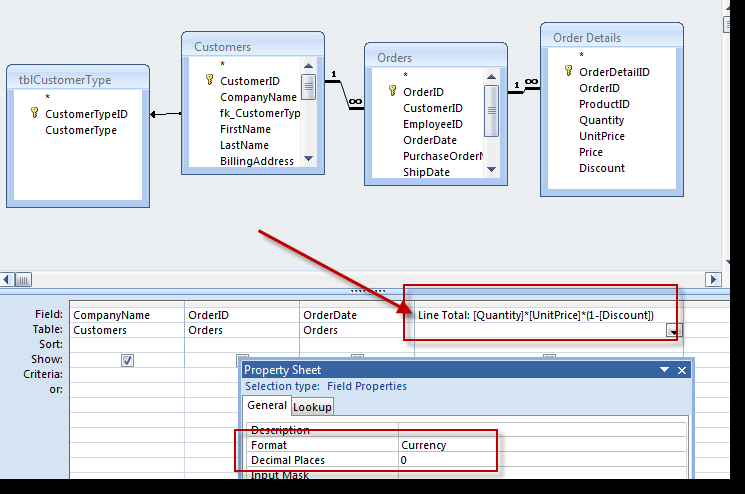
Reports allow the presentation of selected data from the database.
The output can be customised in a variety of ways, including displaying only chosen fields and formatting the data in a particular way.
Here is a report which has been produced to show details of all employees who earn more than £30000.
The above report has less fields than the full database and also includes a header and summary fields. Changes to the formatting of the Birth Date column and other column headings.
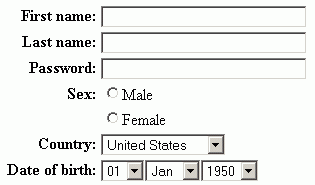
Database creators can prepare forms layouts specially designed for inputting data, to help improve usability.
A well laid-out form, using suitable techniques such as drop-down menus or checkboxes, reduces the typing required and makes data input easier and faster.
A data dictionary is a design notation used to show the fields required in each table of a relational database, including field types, validation required, etc.

Thank you to C O’Toole & A Madill from Braidhurst High School for allowing me to edit and publish this here.