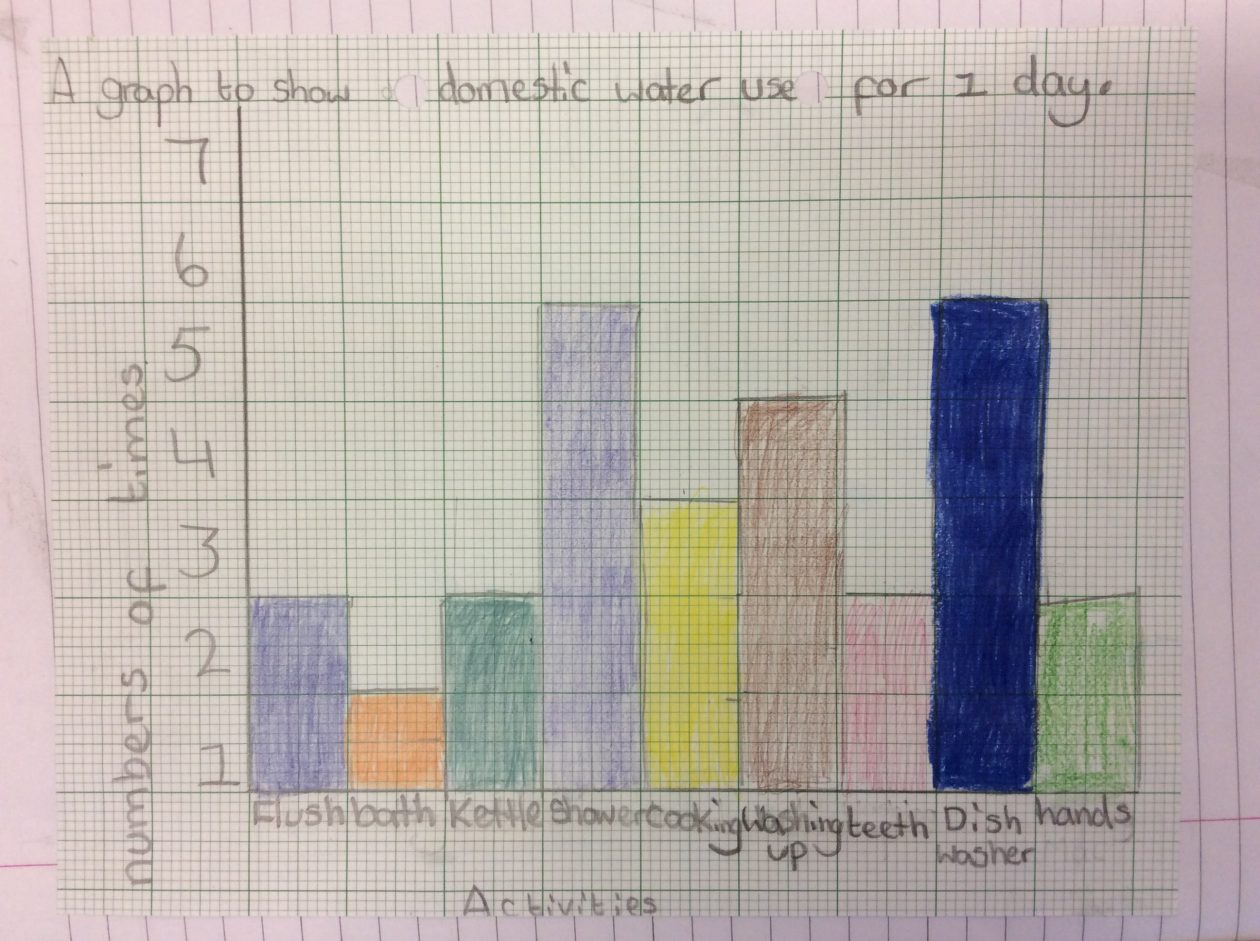

To show people how many times we use water in the house, we took the information from our Water Use Tally and transferred the information into a Bar Graph. We had to look carefully at the scales to make sure that we could fit the information onto the sheet. Our title had to explain what the graph was showing and the axes had to be clear. These examples demonstrate super learning.
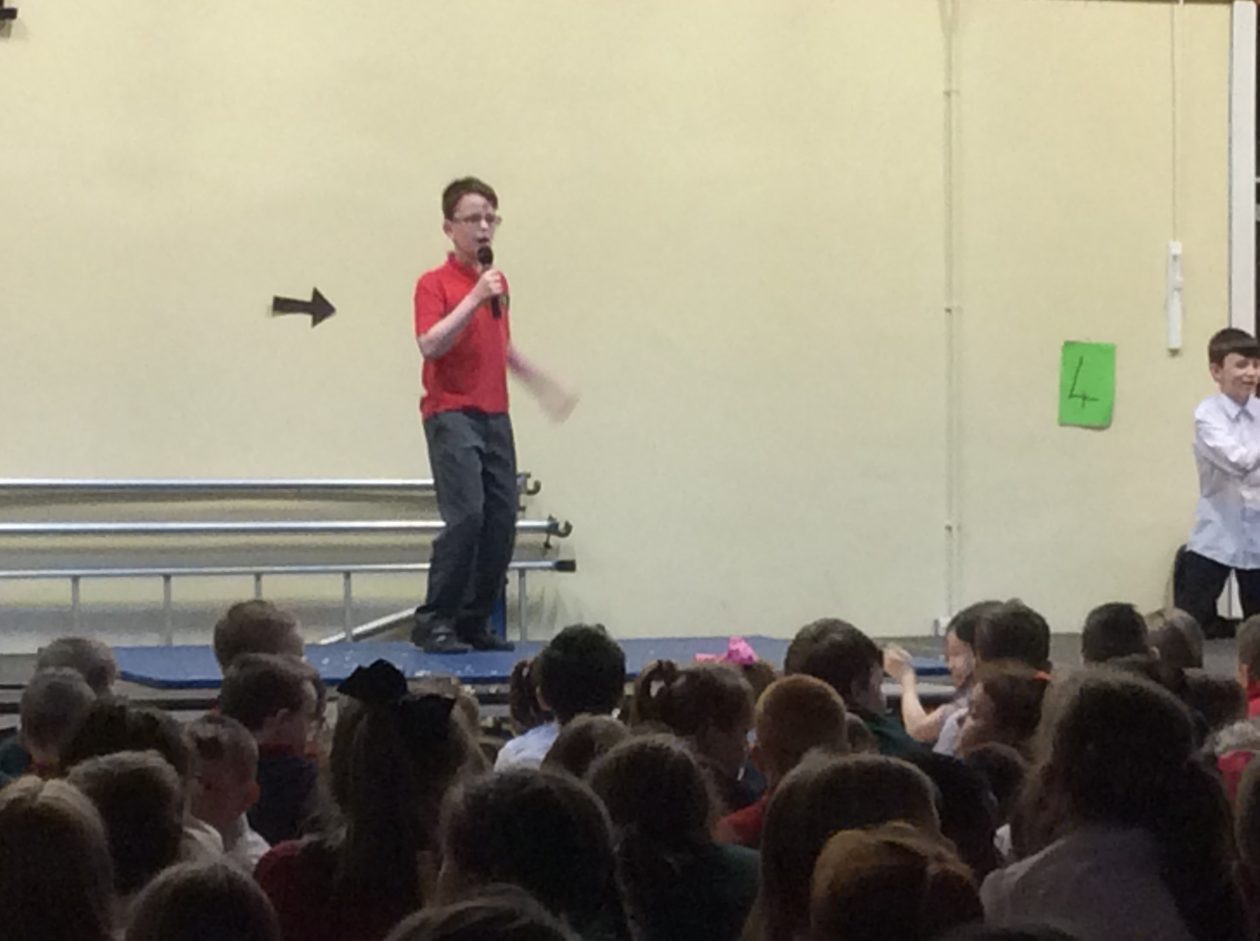
This afternoon we were treated to some excellent acts for Woodlands’ Got Talent. Two of our pupils were through to the final and performed really well- we are very proud of you!
Have a lovely long weekend and we will see you next Thursday.