We have been learning to create and interpret graphs. We started by creating a whole class pictograph, showing different hair colour in our class. We realised that the most common hair colour in our class is blonde. We then answered questions to interpret the graph. We also create a pictograph showing our favourite flavours of crisps.
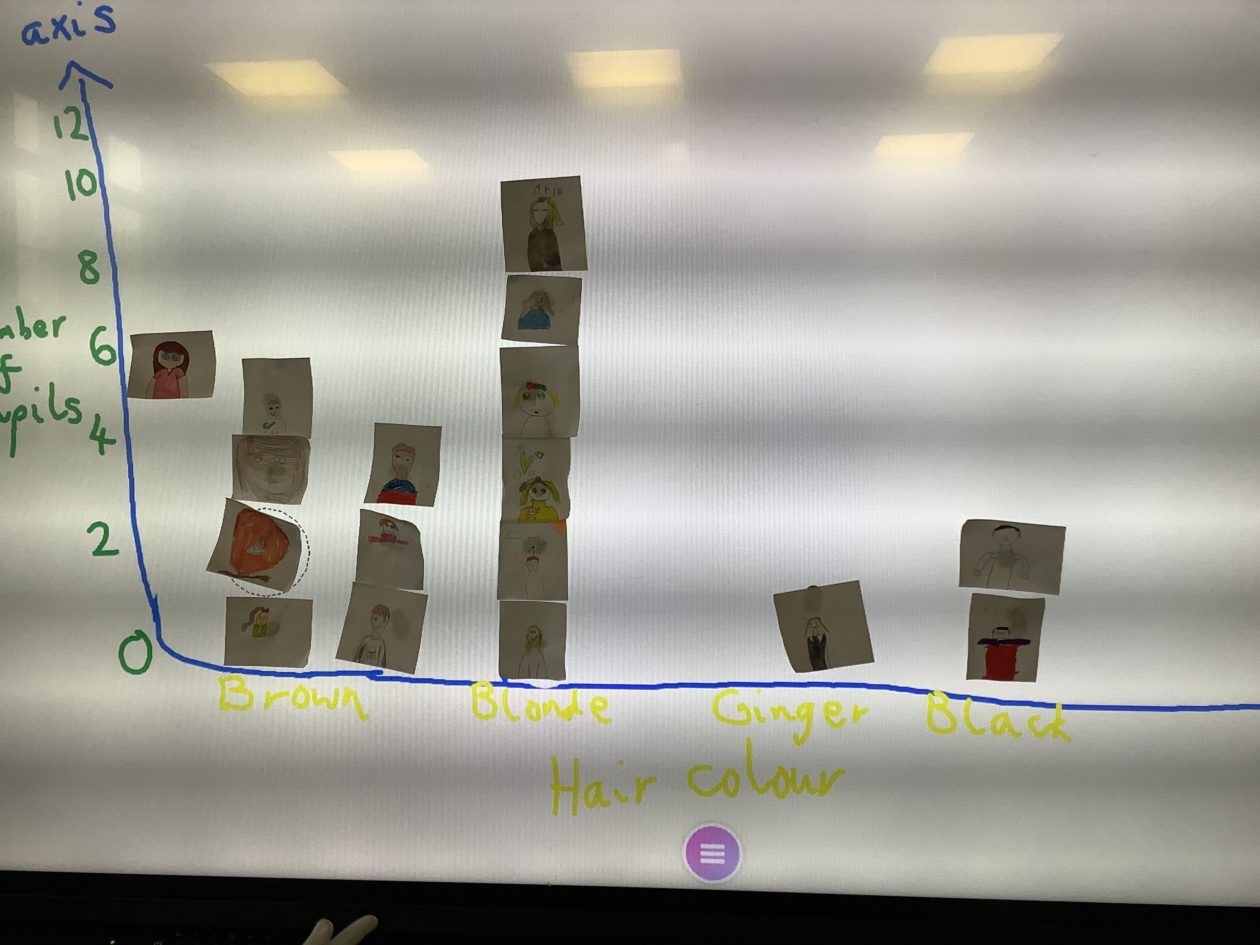
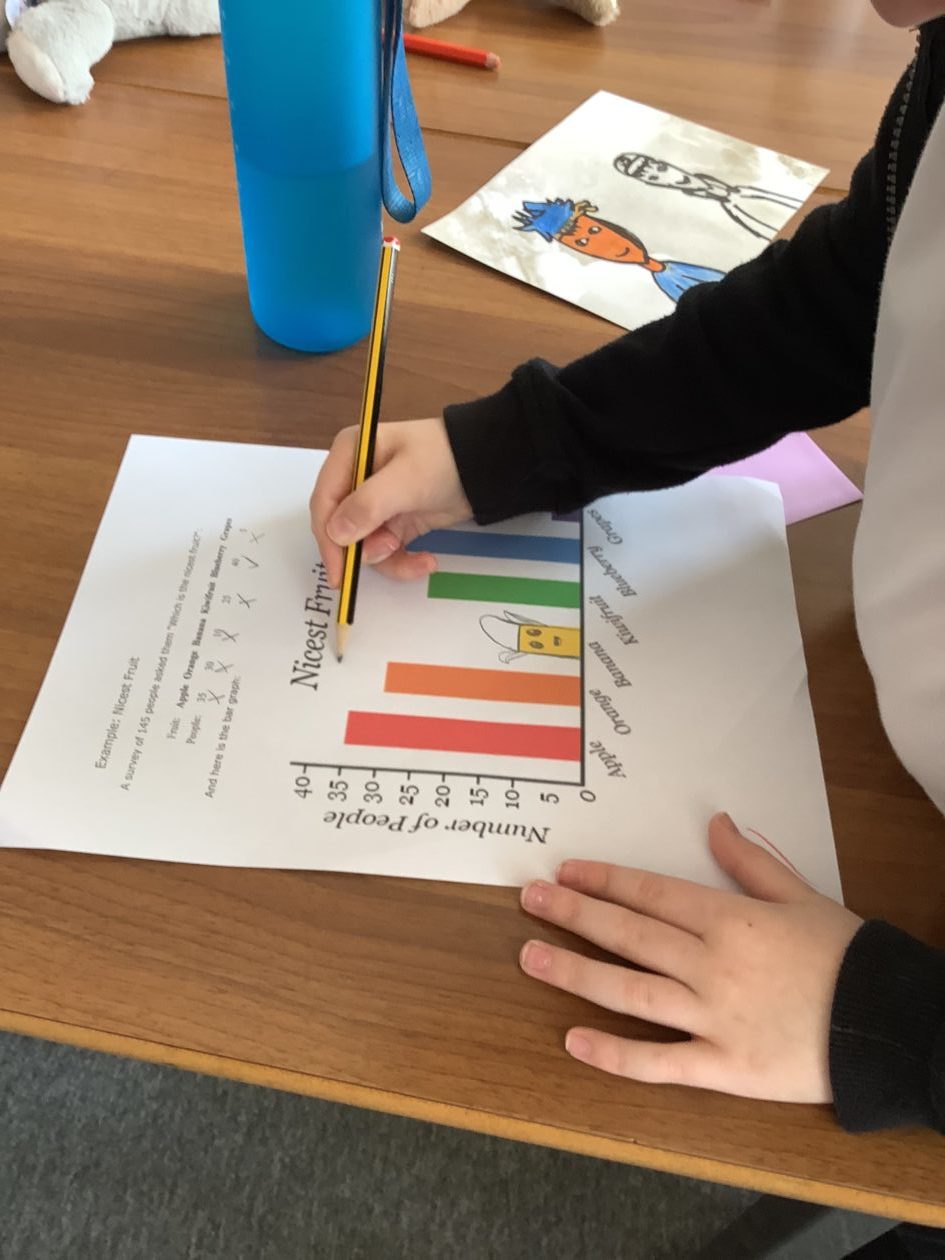
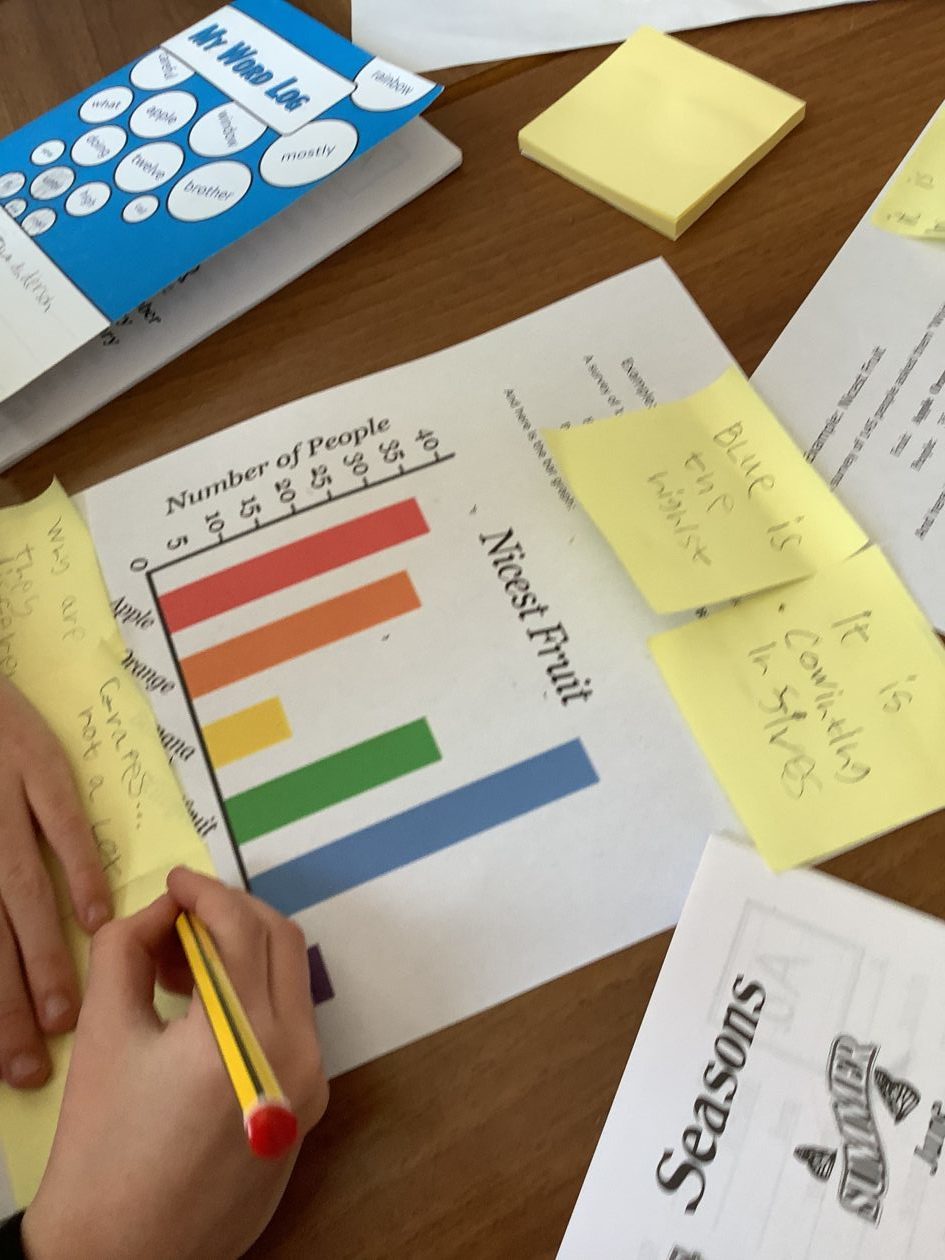
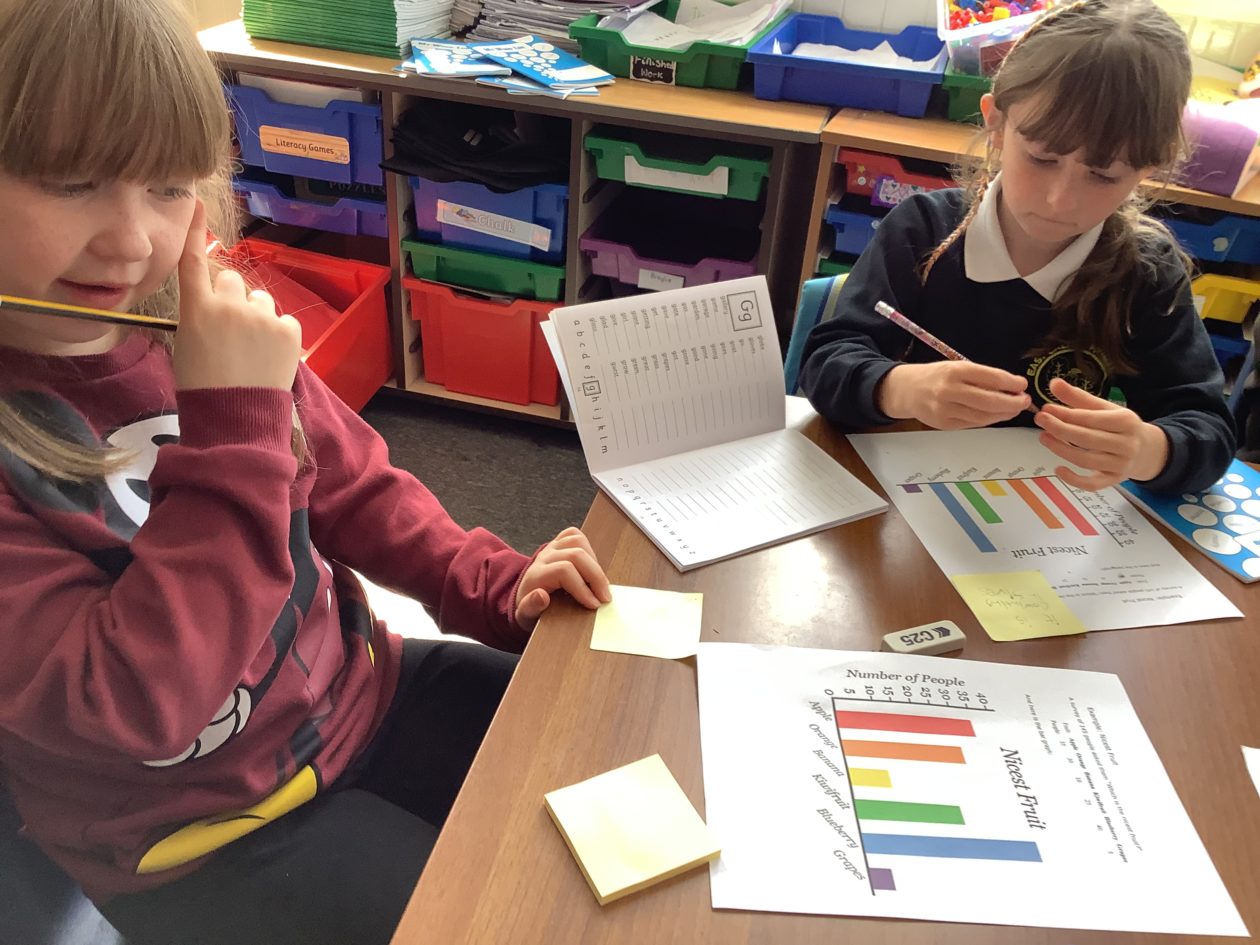
We have enjoyed interpreting different graphs and we have made some interesting observations, talking about what we notice, and answering and asking questions. We wrote on sticky notes to show our thinking and we shared our ideas with each other.
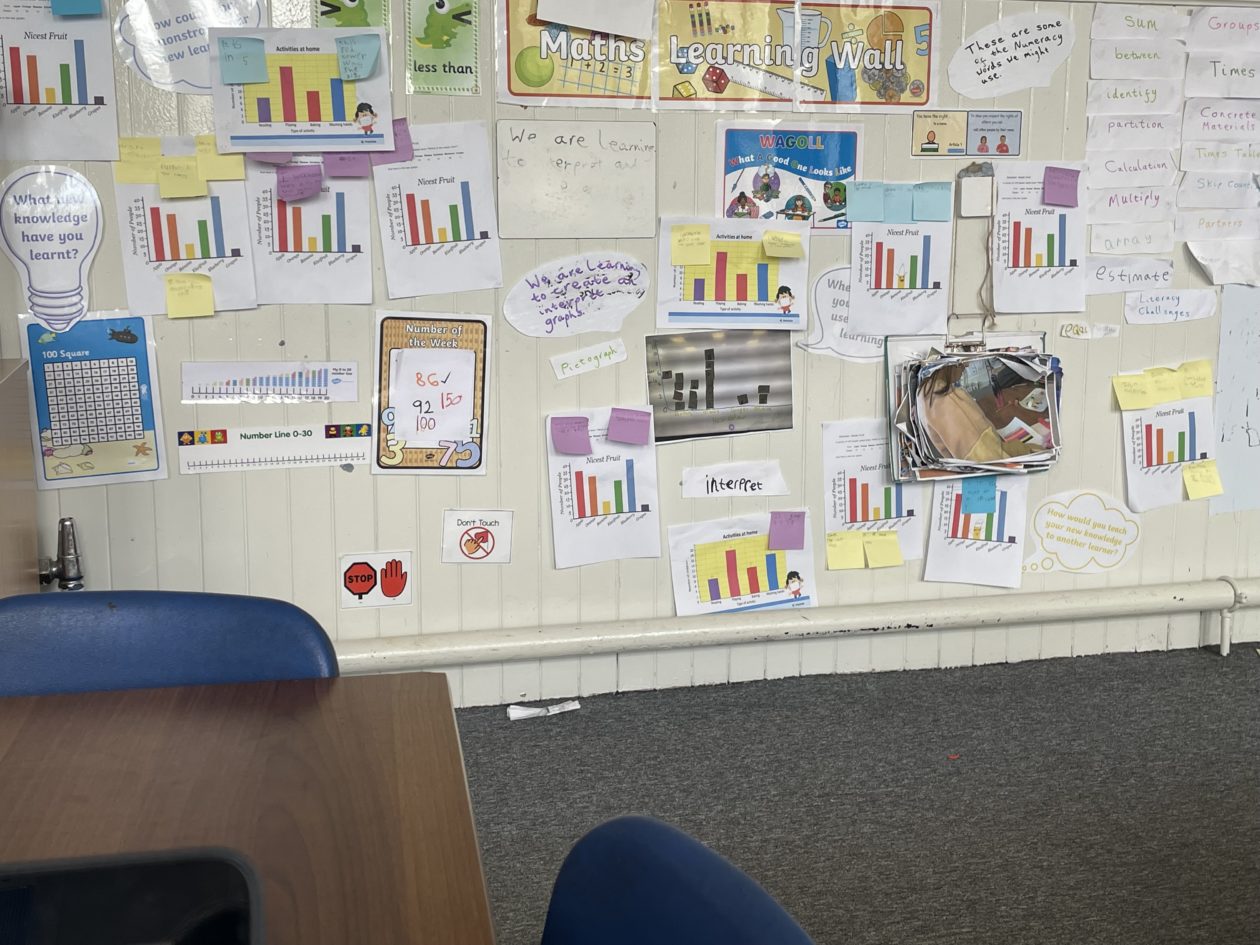
We displayed our learning on our Maths and Numeracy Wall to help us talk about what we learned. We were very confident talking about our learning using the correct language including data, graph, interpret, title and categories.
We have also learned to gather information and display this in a Tally Chart, and then use the information to create a bar chart. We are excited to take our learning outside next week, where we will be creating a Tally Chart and bar graph in our playground.
Article 13: We have the right to find out things and share what we think with others.
Finlay said this Article was displayed with our Learning Intention because the children were sharing their ideas and learning something new.