Category: Revision

National 5 – Media Types (Revision)

Standard file formats:

  • Text:
    • txt – only text stored no formatting
    • rtf – Rich Text Format, text and formatting stored, new standard allow for the storing of embedded images.
  • Audio:
    • wav – uncompressed audio
    • mp3 – compressed audio
  • Graphics:
    • jpeg – used for photographs due to strong compression
    • bmp – uncompressed
    • gif – used for animations and drawings, few colours
    • png – compressed with partial transparency.
  • Video:
    • mp4 – compressed
    • avi – uncompressed
  • Pdf: Portable Document Format – used to retain the look and format of a document across difference platforms. Document always looks the same regardless of screen size, fonts etc.

Factors affecting file size and quality

  • Resolution – the number of pixels used to make up the picture.
  • Colour Depth – the number of possible colours used to make up a pixel. The more possible colours the greater the file size.
  • Sampling Rate – in sound files the number of recordings taken per second., the greater the sample rate the higher the quality and file size.


Calculation of file size for colour bitmap.

Horizontal Pixels = image width x resolution(DPI)

Vertical Pixels = image height x resolution(DPI)

Number of pixels = Horizontal Pixels x Vertical Pixels

File Size = Number of pixels x colour depth (in bits)

Example 1

N5G

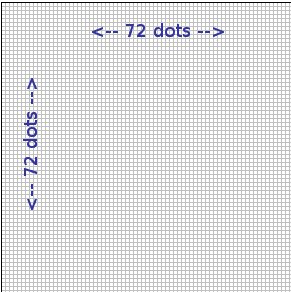
This is enlarged but is 1 inch by 1 inch.

In that case there are 72 x 1 x 72 x 1 = 5184 pixels

Example 2
Bitmap with a resolution of 600×600 pixels in 8 bit colour.
Storage requirements

600 x 600 x 1 bytes = 360000
It is 1 byte as it is 8 bits per pixel
360000/1024 = 351.6 kilobytes

Example 3
Calculate the number of pixels in 4 inch by 5 inch photograph scanned which has a resolution of 600 dots per inch.

Pixels = 4 x 600 x 5 x 600 = 7,200,000 bits
7,200,000 / 8 = 90000 bytes
90000 bytes / 1024 = 878.9 Kb

Vector Graphics
It is possible to edit each object separately, for example, change the shape, colour, size and position.
Even if an object in a vector graphic is quite large, it doesn’t need a lot of computer memory. Therefore the file size of a vector graphic is often very small.
Vector graphics are scalable when you resize them, they do not lose quality.

Need for compression – reduces the file size so that the web page loads more quickly. Reducing bit depth has the same impact. Quality of the image is affected.

Higher – Media Types (Revision)

Compression

  • Appropriate use of compression can reduce file sizes.
  • Small file sizes can be transmitted and processed more quickly.

For example, a whole webpage can be compressed, reducing the amount of data which has to be sent to the client computer and therefore reducing the load time. The browser will decompress the page before displaying it.

Individual media elements audio, graphics and video within the webpage could also be compressed in order to reduce the size further.

  • Lossless compression reduces file sizes without removing any data.
  • Lossy compression reduces file sizes by removing some data.

Audio Formats

MP3 (.mp3) Lossy compression

  • Removes the very high or low frequencies that humans cannot hear.
  • When two similar sounds (but different volume) occur at the same time, removing the quieter one.
  • User can choose the level of compression.
  • A full compression MP3 compresses data to around 10% of the original size, with relatively little loss of quality.

Audio File Size Calculations

To calculate the file size (in bits) of an uncompressed audio file the basic formula is:

sample frequency (Hz) x sample depth (bits) x length (seconds) x number of channels

  • Sample frequency is the number of times per second that a sample of the original sound was taken.
    1 Hz = once every second. 1 KHz = 1000 times every second.
  • Sample depth is the number of bits that were used to store each sample.
  • Length of sound should always be converted into seconds if necessary.
  • Number of channels is typically 1 (mono) or 2 (stereo), although it could be more for a surround sound file.

Calculate the file size of a mono voice recording captured at 24KHz with a sample depth of 8 bits, lasting for 15 seconds.

24000 x 8 x 15 x 1 = 2880000 bits
2880000 / 8 = 360000 bytes
360000 / 1024 = 351.56 KB

Graphic Formats

JPEG (.jpg) Lossy compression

  • 24 bit colour.
  • Allows the user to select an appropriate level of compression.
  • JPEG is a good compression format for high-quality images and images where quality is unimportant (e.g. thumbnails).

PNG (.png) Lossless compression

  • Intended to improve upon GIF format.
  • 24 bit colour.
  • Allows user to set alpha level for improved transparency.

GIF (.gif) Lossless compression • Restricted to 8 bit colour.

  • Uses LZW algorithm to compress data.
  • Several images can be stored in one GIF file, allowing for animation.
  • Allows a specific colour in an image to be made transparent.
  • GIF is a good compression format for images with areas of flat colour, images that have few colours, animated images or images that require transparency.


RLE (Run Length Encoding) is a lossless compression algorithm.

  • It works by taking runs of the same colour and storing them as two numbers: how many pixels and colour code of this run of pixels.
  • RLE works best for images with large blocks of the same colour.
  • If an image has many different colours (e.g. a photo) RLE could potentially end up increasing the file size!

LZW (Lempel Ziv Welch) is a lossless compression method which is more effective than RLE.

  • It works by looking for repeated patterns of bits within data, stores them in a dictionary, then replaces them with references to the dictionary.

Indexed colour involves storing the actual RGB codes used by the image in a separate colour palette, in order to reduce file size. This can be used as a compression technique where the bit depth of the graphic is less than 24.

Graphic file size calculations

To calculate the file size (in bits) of a bitmap graphic file the basic formula is:

number of pixels in image x bit depth

  • Bit depth or colour depth is the number of bits that were used to store the colour of each pixel.

Example 1
Calculate the file size of a 400 x 400 pixel graphic with a colour depth of 24.

400 x 400 = 160000 pixels in the image
160000 x 24 = 3840000 bits
3840000 / 8 = 480000 bytes
480000 / 1024 = 468.75 KB

Example 2
Calculate the file size of a 300 x 200 graphic with 256 colours.
256 colours means a colour depth of 8 (because 28 = 256)

300 x 200 = 60000 pixels in the image
60000 x 8 = 480000 bits
480000 / 8 = 60000 bytes
60000 / 1024 = 58.6 KB

Example 3
Calculate the file size of a 6’ x 5’ image, scanned at 200dpi, with 16 bit colour.

6 x 5 x 200 x 200 = 1200000 pixels in image
1200000 x 16 = 19200000 bits
19200000 / 8 = 2400000 bytes
2400000 / 1024 = 2343.75 KB
2343.75 / 1024 = 2.3 MB

Video Formats

MPEG (.mp4) Lossy compression

  • The level of compression can be determined by the user.
  • Key frames (individual still images) are compressed and stored as JPEGs – generally only one full frame in every 8 to 24 frames needs to be stored.
  • Any data that stays the same beyond the key frame does not need to be stored. Changes to the image in each subsequent frame are then stored.

AVI (.avi) No compression built-in

  • Limited to 320 x 240 resolution
  • Limited to 30 frames per second
  • Can take up a large amount of storage space and can be quite RAM intensive.

Video file size calculations

To calculate the file size (in bits) of an uncompressed video file the basic formula is:

number of pixels in frame x bit depth x frame rate (fps) x length of video (in seconds)

A video is simply a series of bitmap images, so this rule simply multiplies the size of one image by the number of images in the video.

Calculate the file size of a 300 x 250 pixel video, using 16 bit colour, 30 frames per second and lasting 30 seconds.

300 x 250 = 75000 pixels
75000 x 16 = 1200000 bits for 1 image
1200000 x 30 = 36000000 bits for 1 second of video
36000000 x 30 = 1080000000 bits for entire video
/8 = 135000000 bytes
/1024 = 131835.94 KB
/1024 = 128.75 MB

Thank you to C O’Toole & A Madill from Braidhurst High School for allowing me to edit and publish this here.


Higher – Structures and links database (Revision)

A database is a collection of data stored in a structured, organised manner.

Flat file databases

A flat file database has all data is contained in one file (a table or entity).

Data is organised into fields (columns or attributes) and records (rows or occurrences).

Field Types

Basic field types include: text, numeric, date, time.

Other field types include:

  • Object (a container) – can contain graphic, audio, video, etc.
  • Link – contains a hyperlink.
  • Calculation – contains a formula to calculate its contents from other data in the record. Automatic calculation of data reduces the chance of human error.
    • HDB1
  • Boolean – stores Yes/No or True/False.
  • Summary – calculates data based on data from multiple records in database. For example, totals up the contents of a particular field across all records.

Relational Databases

Relational databases have two or more files linked together. Using linked tables reduces unnecessary duplication of data, therefore reducing the opportunity for error.

Good database design avoids data duplication by using linked tables where appropriate and reduces errors in data entry by using suitable validation techniques.

Relationships

There are 3 types of relationships between tables in a relational database.

One-to-one (1:1)

  • One record in the first table can only link to exactly one record in the second table.
  • One-to-one relationships are rarely used, except as a means of splitting up a large, unwieldy table or treating part of a table differently (e.g. keeping some fields secure).
  • Example
    • In a database with a Customer Details table linked to an Account Details table – one customer can only have one account, and vice versa.
    • However, the Customer Details table can be made available to all staff whilst the Account Details table could only be available to senior staff.

One-to-many (1:M)

  • One record in the first table can link to two or more records in the second table.
  • Each record in the second table can only be linked to exactly one record in the first table.
  • Example
    • In a database with a Customers table linked to a Tickets table – one customer can have many tickets, but each ticket may only have one customer.

Many-to-many (M:M)

  • One record in the first table can link to two or more records in the second table.
  • One record in the second table can also link to two or more records in the first table.
  • Many-to-many relationships are usually undesirable in relational database design.
  • Example
    • In a database with a Pupils table linked to a Teachers table – one pupil can have many teachers, and vice versa.

Entity Relationship Diagrams

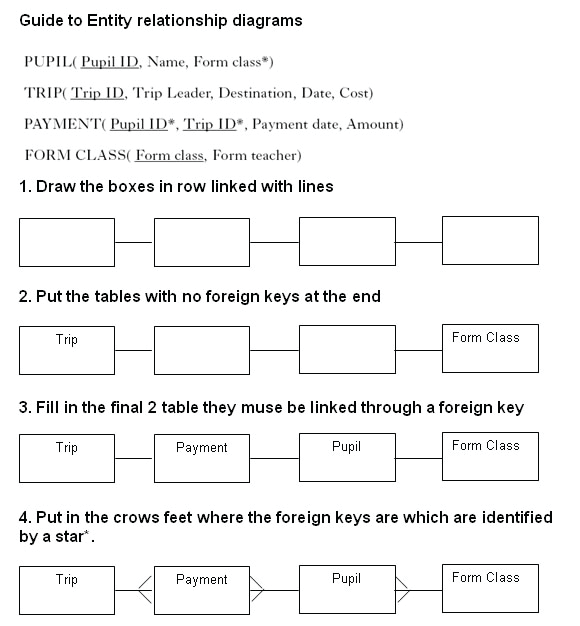
Relationships can be represented graphically using an Entity-Relationship (ER) diagram.

There are many different notations for ER diagrams, we will use crow’s foot notation.
• The names of entities are written in boxes joined by straight lines.
• At the “many” end the line forks.
• At the “one” end the line it judt joins the box.

ERD

Keys

  • Primary Key
    • A primary key is a field which is a unique identifier for each record.
    • A file may have only one primary key.
    • At the design stage, primary keys are usually identified by underlining.
  • Foreign Key
    • A foreign key is the primary key copied from another file, used to link two files.
    • In order to create a link, the primary key from the “one” entity gets copied into the “many” entity as a foreign key.
    • At the design stage, foreign keys are usually identified using an asterisk.
  • Compound Key
    • A compound key is a key which consists of two or more fields in order to create a unique identifier. This is required when no single field can be used to uniquely identify a record.

Example

Litters	(Litter ID
		Sire
		Dame
		Number in litter
		DOB)

Puppies	(Puppy ID
		Puppy name
		Sex
		Cost of puppy
Litter ID*)

Customers	(Customer name
		Address
Puppy ID*)

There are 3 tables in this database.

•	The Litters table has Litter ID as a primary key.
•	The Puppies table has Puppy ID as a primary key.
•	The Customers table uses Customer name and Address as a compound key.

•	Litter ID is a foreign key in the Puppies table.
This creates a one-to-many relationship between Litters and Puppies.

•	Puppy ID is a foreign key in the Customers table.
This creates a one-to-many relationship between Puppies and Customers.

Field Validation

Using appropriate validation reduces the chance of error when data is input.

Various validation techniques can be used to ensure data is appropriate:


  • Presence check – ensures field cannot be left empty, good validation for a primary key.
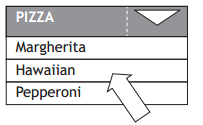
  • Restricted choice – the user is presented with a list of options to choose from using a drop-down menu, option buttons or similar. This is often used for the input of data for a foreign key, by automatically generating the list of options from the linked file.
  • Length check – ensures an appropriate number of characters is input, e.g. minimum of 8 characters, maximum of 20.
  • Range check – used on numeric fields to ensure number is within certain range e.g. between 0 and 100.

Queries

Queries allows the user to find information in a database.

Users may perform simple queries looking at the contents of one field or complex queries looking at the contents of many fields.

When answering exam questions always state what data is being searched for and which field it should be in.

Examples
To find all the male pupils who are over 12 SEARCH for “male” in the Gender field AND >12 in the Age field
To find all the people who live in Edinburgh or Glasgow SEARCH for “Edinburgh” in the Town field OR “Glasgow” in the Town field
To find all the people born in the 1990s SEARCH for >31/12/89 in the DOB field AND <1/1/00 in the DOB field


Sorting

Sorting puts database records in order based on the contents of particular fields.

  • Ascending order goes from A to Z, smallest number to largest number.
  • Descending order goes from Z to A, largest number to smallest number.
Examples
Put the customers in alphabetical order SORT on Surname field in Ascending order then the Forename field in Ascending order.
Find the tallest person in the database SORT on Height field in Descending order then look at the first record in the list.

Reports

Reports allow the presentation of selected data from the database.

The output can be customised in a variety of ways, including displaying only chosen fields and formatting the data in a particular way.

Here is a report which has been produced to show details of all employees who earn more than £30000.

HDB2

The above report has less fields than the full database and also includes a header and summary fields. Changes to the formatting of the Birth Date column and other column headings.

Forms

Database creators can prepare forms layouts specially designed for inputting data, to help improve usability.

A well laid-out form, using suitable techniques such as drop-down menus or checkboxes, reduces the typing required and makes data input easier and faster.

DB3

Data dictionaries

A data dictionary is a design notation used to show the fields required in each table of a relational database, including field types, validation required, etc.

dd

Thank you to C O’Toole & A Madill from Braidhurst High School for allowing me to edit and publish this here.
National 5 – Structures and links database (Revision)

Database structure:

  • field – the fields below; Exhibitor, Company Name, Area, Stand Number, Product Reference, Item Name, Price (£)
  • record – A single row in a table, there are 8 records below
  • file – the entire database

Flat file database

  • flat file all the data is stored in one table
  • DB1
  • Drawbacks Data duplication Data inconsistency or update/ deletion/insertion anomalies Data integrity errors (due to data inconsistency) Inconsistent search results in multi-value fields
  • Flat file databases can lead to errors as shown below

    DB4

    Is it a man John Silver or a woman Joan Silver for member 1034?

Linked tables

  • Table would be split into
    • EXHIBITOR(Exhibitor Code, Company Name, Area)
    • PRODUCT(Product Ref, Item name, Price (£), Exhibitor Code*)
  • primary keys – these are unique identifiers for each row in a table
  • foreign keys – a primary key from a different table

Database operations

  • Simple search – a search on ABC Music would return the following
    • DB2
  • Complex search – Searching on two (or more) fields at once for example Company name = FutureTech and Price > 1500 would return the following
    • DB2
  • Simple sort – Sorting a table by one field, class registers are sorted by surname
    • Allan, Tom
    • Bennet, Gordon
    • Clark, Petula
    • Donaldson, Luke
    • Elliot, Paula
  • Complex sort – same as above but if two people have the same second name they are sorted by first name as well
    • Allan, Tom
    • Bennet, Gordon
    • Clark, Petula
    • Donaldson, Luke
    • Elliot, Paula
    • Ferguson, Alex
    • Ferguson, Sarah
  • This is in an Ascending order

Field types

  • text – A Roberts, ML1 3XF
  • numbers – 124
  • date – 29 April 2012
  • time – 08:30
  • object – Picture, video or sound file.
  • calculated – pay * 20%
  • link – www.bbc.co.uk
  • Boolean – either yes or no

Validation

  • presence check – data must be entered before the user can continue, primary and foreign keys are normally required.
  • restricted choice – please see below, the user can only select one option.
    • DB3
  • Benefits
    • Reduces the chance of human error
    • Does not require the user to type a text response
    • Speeds up the ordering process as inputs are reduced to mouse clicks
    • Allows the use of a touchscreen
    • Good design to avoid data duplication and modification errors (insert, delete, update)


Higher – User Interface (Revision)

  • Usability: how useable software is in relation to its intended purpose; usability testing involves a target group of users who are often asked to perform a series of tasks under controlled conditions
  • Accessibility: how easy it is for users with disabilities to make full use of software that has been developed; examples include voice recognition and text to speech software; read out alt attribute on image tags on websites

Thank you to C O’Toole & A Madill from Braidhurst High School for allowing me to edit and publish this here.

National 5 – User Interface (Revision)

User requirements

visual layout –  eye-catching, simple to use and clear of cluttered buttons and text.

navigation hierarchical, with links organised into sub categories, or linear, where pages are visited in one step-by-step order.

selection – options include clicking on a menu or radio buttons or filling in a form.

consistency – using the same font, colours styles & menus

interactivity – using video/audio, allowing users to post comments etc

readability – use white space and short pages to ensure it is easy to read.

Accessibility – Reading text aloud, alt attributes on image tags or having large fonts for users with eyesight issues.

Higher – Contemporary Developments (Revision)

Exemplification of trends in the development of:

  • Software Development Languages: use of pre-processors (allow a programmer to implement code in a language that will be translated into another before becoming machine code); use of frameworks (provides a pre-generated set of code programmers can use for design); app development (web apps used to handle different operating systems, software development kits used to create one app that can be changed for different operating systems); HTML5 (latest version of HTML)
  • Software Development Environments: use of text editors, graphical user interface creation, de-bugging tools, collaboration tools and the cloud, emulators and mini development environments via browser software
  • Intelligent Systems: designed to demonstrate aspects of human intelligence by using a computer system to replicate human decision making and interaction; key features include ability to learn, ability to make decisions without human input, presence of several aspects of human intelligence
  • Online Systems: a system that is interactive (server and client communicate and update data) and fully functional in real time when accessed via the Internet; A ticket ordering web based system or an online shopping site are examples of common online systems

Higher – Development Methodologies (Revision)

  • Rapid Application Development: means that the users should be involved at all stages of the development process and that changes to the design can be made at any time throughout the life of the project; it also means that the development process is faster and more flexible; emphasis is on creating software quickly and efficiently
  • Top-Down/Step-wise refinement: breaking down a problem into smaller more manageable steps

1 Setup Variables

2 Initialise Values
3 Do Calculation

1.1 Create number1 as a global variable
1.2 Create number2 as a global variable

2.1 Set number1 to 0
2.2 Set number2 to 0
2.3 Set total to 0

3.1 Receive number1 from keyboard
3.2 Receive number2 from keyboard
3.3 Set total to number1 + number2

  • Agile Methodologies: a product of RAD; emphasis on small scale developments, and with teams of people who have a flexible approach to change in requirements; it is important to keep the client involved in the process; there should be daily meetings between the clients and the developers, and necessary changes made to the requirements even late in development

Thank you to C O’Toole & A Madill from Braidhurst High School for allowing me to edit and publish this here.

Higher – Low-level Operations and Computer Architecture (Revision)

  • Virtual Machines: an emulation of a complete computer system which can be used to run alternative operating systems, or several copies of a single operating system
  • Emulators: software which duplicates the function of one computer system in another
  • Mobile Devices: features which require different types of software from conventional desktop systems eg touchscreen, pinch
  • Binary Representation of:
    • Integers – 163: 1 0 1 0 0 0 1 1
    • Negative Integers – -93: 1 0 1 0 0 0 1 1
    • Real numbers – 16.25: Mantissa & Exponent
      Stored using a mantissa (Larger = greater accuarcy) and an exponent (Larger = greater range)
    • Characters
      • ASCII (American Standard Code for Information Interchange) stores each letter, number or symbol using a number code from 0 to 127; ASCII uses eight bits (1s and 0s) to store each character
      • UNICODE 16bits, larger pool of characters
    • Instructions – represented by machine code as 0s and 1s
    • Vector Graphics – stored as a collection of mathematically determined shapes or objects; each object in the picture has properties such as width, height, fill colour, line colour eg
      <rect height=”96” width=”128” y=”3” x=”90” stroke-width=”6” stroke=”#cc0000” fill=”#ffcc33” id=”yellowrectangle”>
    • Bitmap Graphics – made up of a grid of pixels and stored in memory as a bit pattern of ones and zeros (calculations are mentioned later in this booklet)bm
    • Sound – sample rate (the number of times the value of the signal is recorded) and its bit depth (the number of bits used to store the sample)
    • Video – storing video requires both images and sound to be stored together; files will be very large as a result so compression is always used unless the video is being recorded for editing later; each frame in an MPEG video is compressed as a JPEG; the data that stays the same in successive frames is then removed
  • Processor: consists of several different parts:
    • the Arithmetic and Logic Unit which performs calculations;
    • the Control Unit which loads, decodes and executes instructions,
    • Registers which are small memory locations used by the processor
  • Cache: a faster kind of memory which stores copies of the data from frequently used main memory locations
  • Read Only Memory: Permanent memory; data is not lost when power switched off; this memory is very important and is used to store programs, like the operating system, for a long time
  • Random Access Memory: used to hold all data required for an active program or application to run; data is transferred from backing storage to RAM and held there until it is no longer required by the processor
  • Address Bus: identify the address of the location in cache or main memory that is to be read from or written to; uni-directional
  • Data Bus: will transfer data to/from the address that is held on the address bus; bi-directional; the amount of data that can be carried by the data bus depends on the word size (width of the data bus)
  • Interfaces: used to allow peripheral devices and hardware to connect to a computer system; allow for differences in speed and the way that data is handled by each peripheral device; an example is a USB; responsible for voltage conversion, status signals, data format conversion