
As part of Digital Learning Week P4 have been learning to create bar charts using Excel from data gathered about types of housing. This linked to our Interdisciplinary Learning Topic on our local environment through maths and technology. The children have explored different ways to record data, they have carried out surveys and then used the data to create the bar charts using Excel.

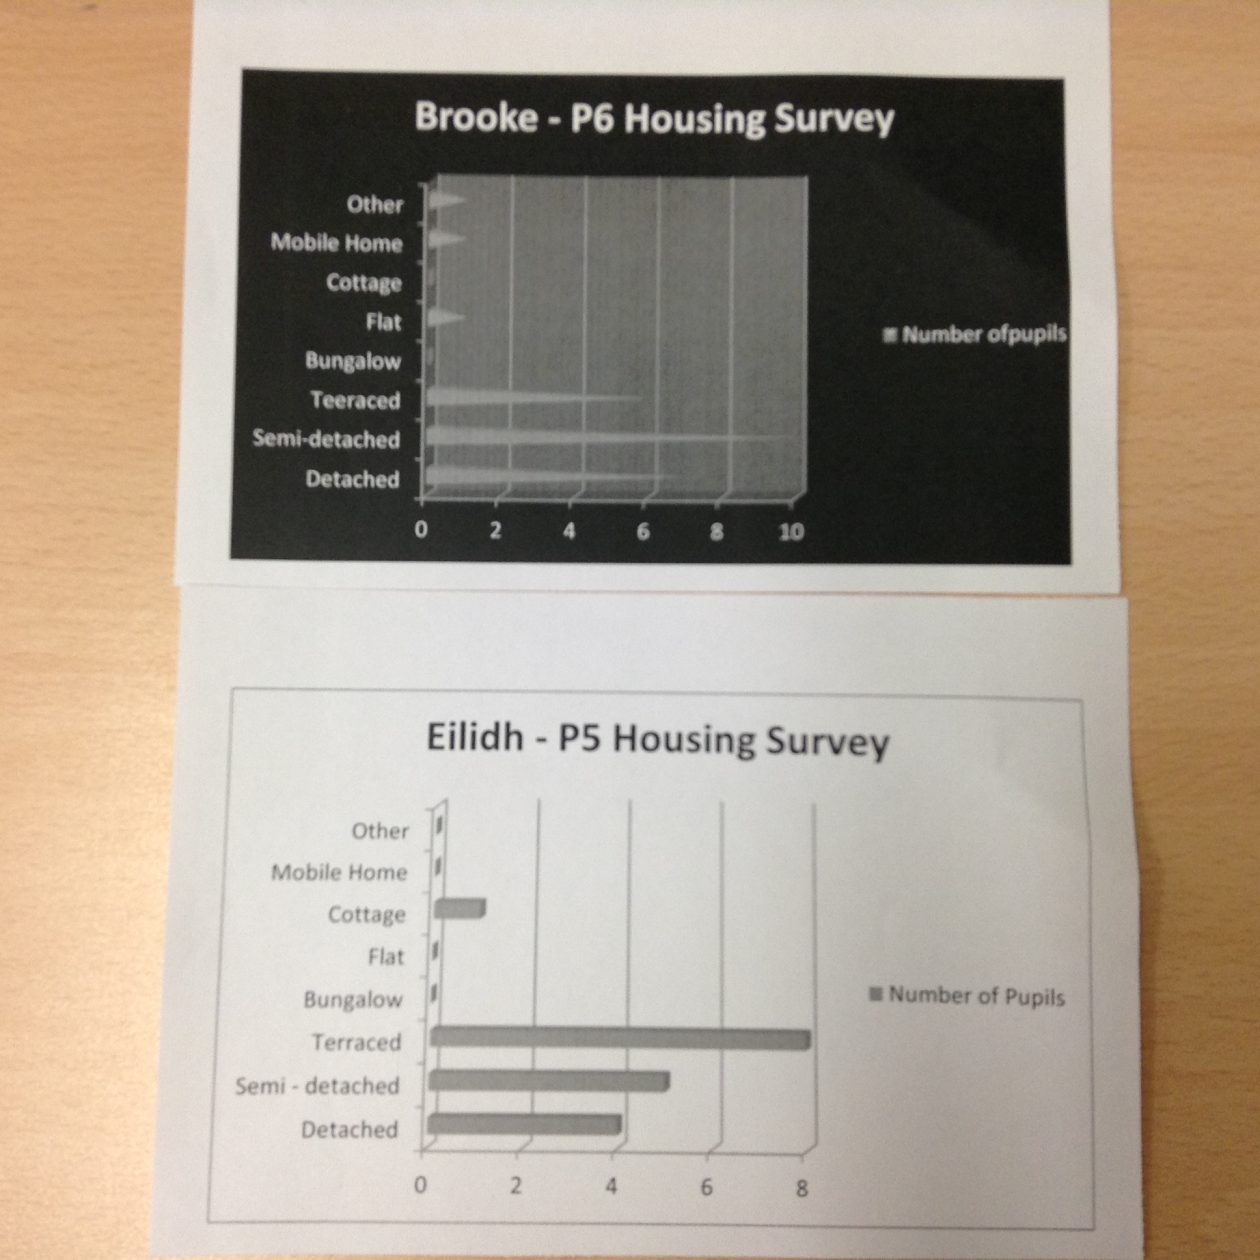
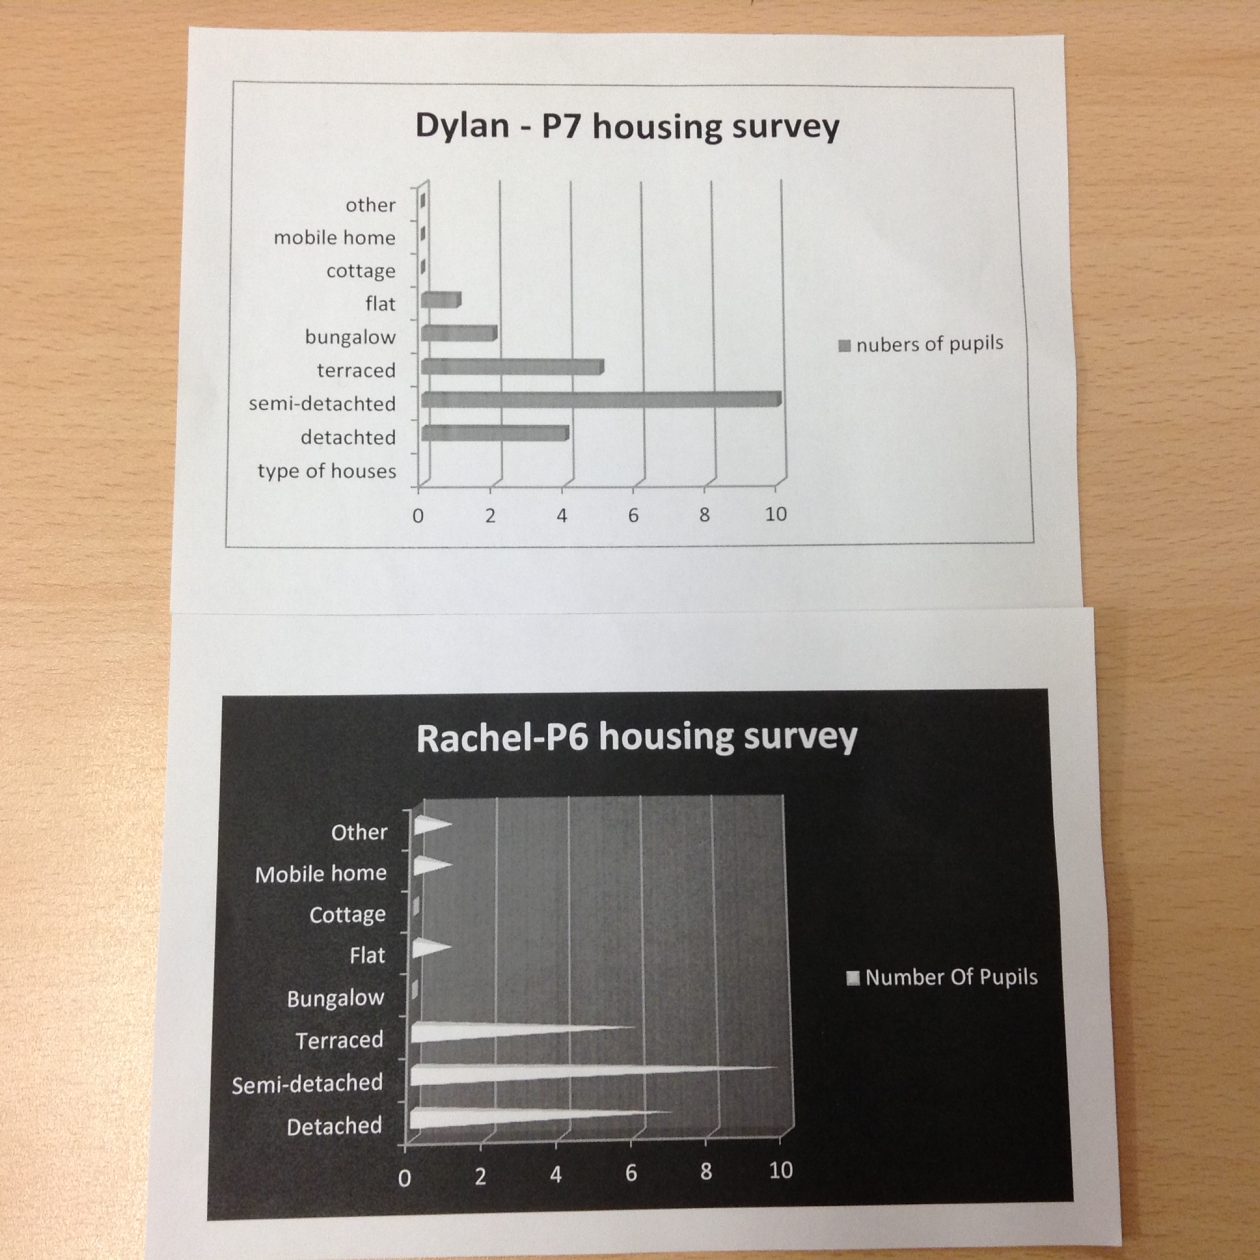
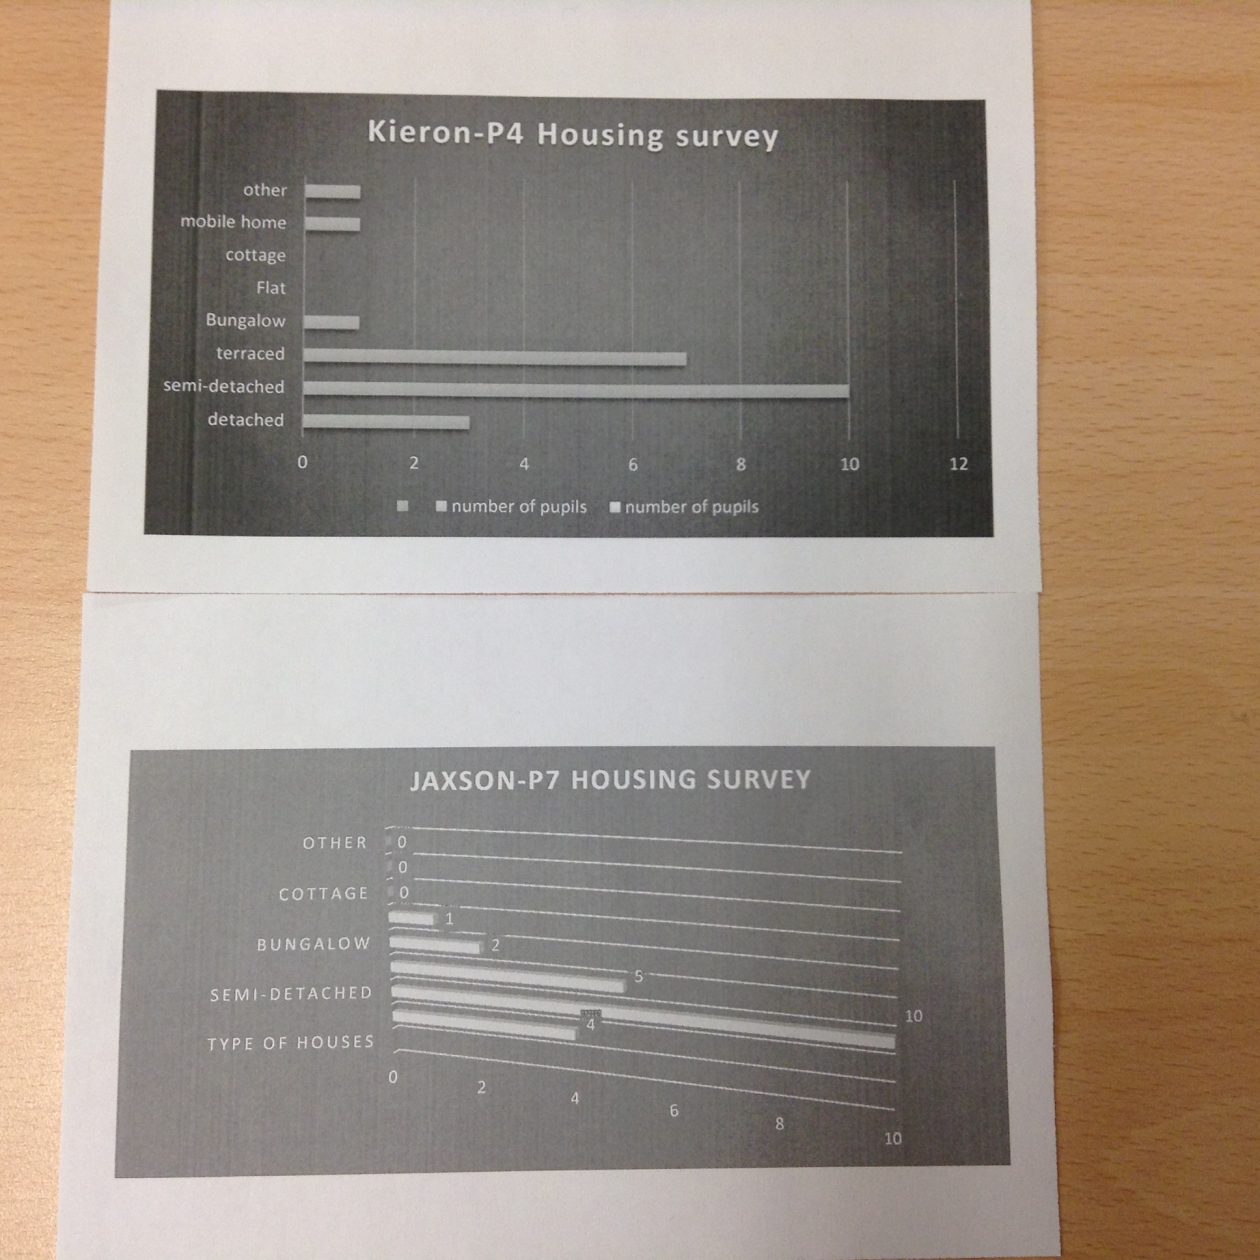
Some examples of our Excel bar charts.