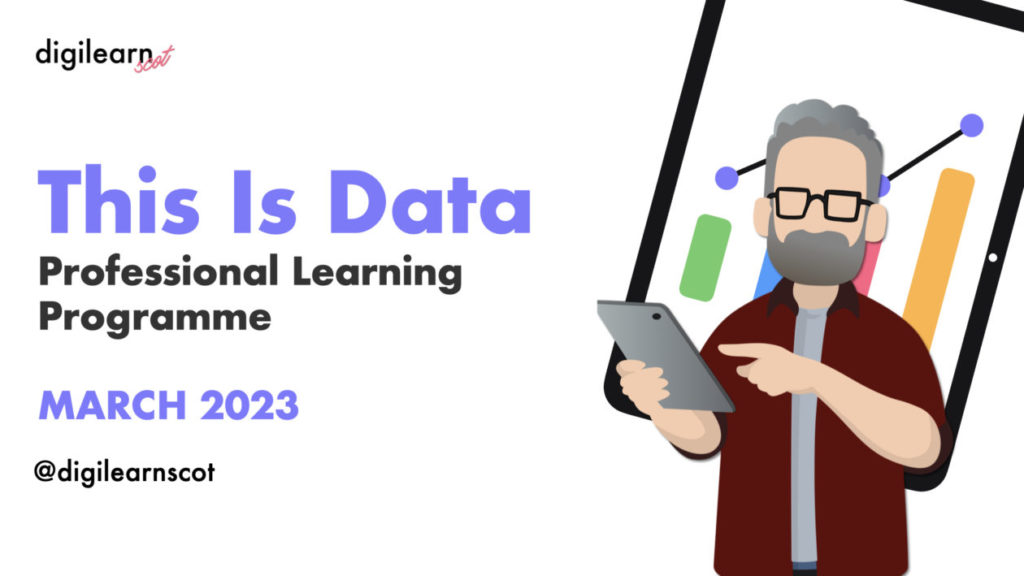
Tag: March23

27 March 16:00 – 15:00, This Is Data Session 3

This Is Data

You may have seen spreadsheet dashboards that react to use interactions, automatically filtering and updating charts and tables. Ever wondered how to do it? This short course will support you to develop you skills to store and process data using tools you already use.

These sessions will show you how to use tables, slicers, pivot tables and charts to bring your data to life. You will be able to use these skills to look at your own data and / or share these skills with pupils as part of their learning.

  • Sample data files will be provided.
  • Basic knowledge of excel will be useful.
  • This set of sessions will make use of Microsoft Excel.

Sign up here for some or all of the sessions below

Session 1 – Monday 13th March 4pm

Preparing data for analysis  – the importance of structuring data in tables, using slicers to filter data, conditional formatting, data validation, custom views and useful formulae

Session 2 – Monday 20th March 4pm

Creating Visual Interactive Dashboards – using your data to create pivot tables and visualisations then bring them together into a single user dashboard

Session 3 – Monday 27th March 4pm

Linking Data – how to link tables and visualise results that draw from more than one data source.

20 March 16:00 – 17:00, This Is Data Session 2

This Is Data

You may have seen spreadsheet dashboards that react to use interactions, automatically filtering and updating charts and tables. Ever wondered how to do it? This short course will support you to develop you skills to store and process data using tools you already use.

These sessions will show you how to use tables, slicers, pivot tables and charts to bring your data to life. You will be able to use these skills to look at your own data and / or share these skills with pupils as part of their learning.

  • Sample data files will be provided.
  • Basic knowledge of excel will be useful.
  • This set of sessions will make use of Microsoft Excel.

Sign up here for some or all of the sessions below

Session 1 – Monday 13th March 4pm

Preparing data for analysis  – the importance of structuring data in tables, using slicers to filter data, conditional formatting, data validation, custom views and useful formulae

Session 2 – Monday 20th March 4pm

Creating Visual Interactive Dashboards – using your data to create pivot tables and visualisations then bring them together into a single user dashboard

Session 3 – Monday 27th March 4pm

Linking Data – how to link tables and visualise results that draw from more than one data source.

21 March 4pm, An Introduction to Digital Citizenship with Common Sense Education webinar

An introduction to Digital Citizenship for Early Learning and Childcare and Primary Practitioners with Common Sense Education.

Prepare your learners for success as digital learners, leaders and citizens. In this 30 minute webinar, you’ll learn the six core concepts on digital citizenship and how you can integrate common sense’s progressive scheme of work into your classroom/playroom.

This webinar is suitable for Teachers, ELC Practitioners including Childminders and Caregivers for early to second level learners.

All resources shared are available for free from commonsense.org/education

Sign up for the webinar using this eventbrite link – Sign up now!

13 March 16:00, This Is Data Session 1

This Is Data

You may have seen spreadsheet dashboards that react to user interactions, automatically filtering and updating charts and tables. Ever wondered how to do it? This short course will support you to develop your skills to store and process data using tools you already use.

These sessions will show you how to use tables, slicers, pivot tables and charts to bring your data to life. You will be able to use these skills to look at your own data and / or share these skills with pupils as part of their learning.

  • Sample data files will be provided.
  • Basic knowledge of excel will be useful.
  • This set of sessions will make use of Microsoft Excel.

Sign up here for some or all of the sessions below

Session 1 – Monday 13th March 4pm

Preparing data for analysis  – the importance of structuring data in tables, using slicers to filter data, conditional formatting, data validation, custom views and useful formulae

Session 2 – Monday 20th March 4pm

Creating Visual Interactive Dashboards – using your data to create pivot tables and visualisations then bring them together into a single user dashboard

Session 3 – Monday 27th March 4pm

Linking Data – how to link tables and visualise results that draw from more than one data source.

03 March 11:00 – 11:45, Code Along – Networks and Radio Communication with micro:bit Second Level Learners +

In this live lesson, for second level learners and above, we will send messages between two or more BBC micro:bits (this is possible with the simulator and with actual devices).  To protect our messages, we will use some simple encryption to ensure that our messages cannot be intercepted and read anyone other than who we intend them to be read by.

Book your class onto this live lesson here.