Pupils put their learning to the test and creating their own questions to ask the class. Using their knowledge of tally marks they recorded the class answers and then out their computer skills to the test.
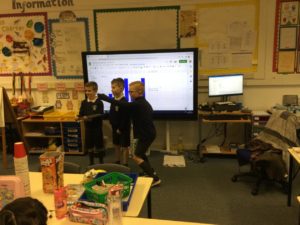
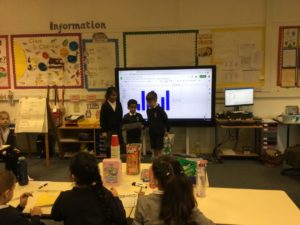
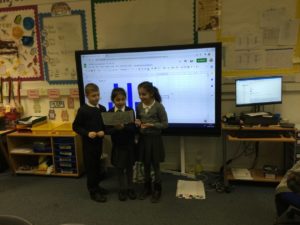
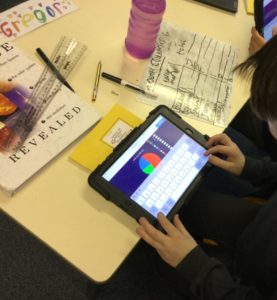
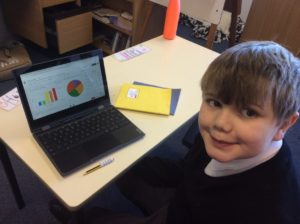
Some pupils even experimented with different types of graphs to represent their data and saw how their data would look with a bar chart, a pie chart and began looking at percentages!
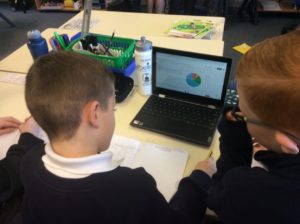
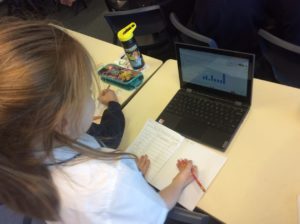
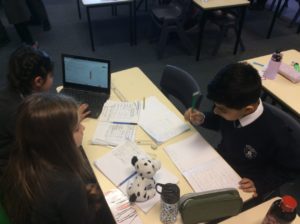
Pupils worked together to create questions to test the rest of the class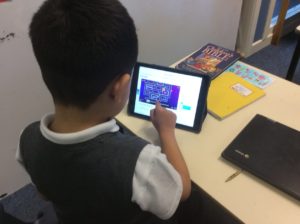
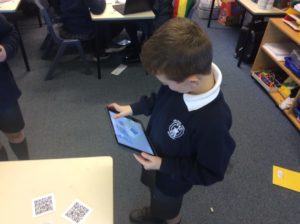
Pupils then scanned QR codes to find different games to test their knowledge about graphs. a busy few days of learning!


