

Write the date and an appropriate title. Please answer the questions showing all working and answer in a sentence to show you have read, understood and fully answered the question. This should be completed by Friday 25th February. If you need help or a paper copy, please ask A.S.A.P.
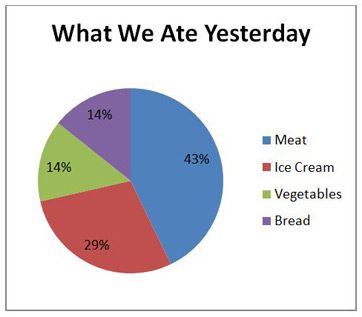
a) What type of chart is this?
b) 200 people were surveyed. What fraction of people ate vegetables? *Remember to simplify!
c) How many people ate ice cream?
d) How many more people ate meat than bread?
- This graph shows how far children jumped at a Sports Day.
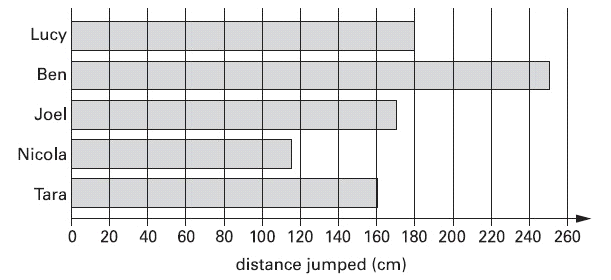
a) What type of chart is this?
b) What is missing from the chart?
c) Tara said “I only needed to jump 80cm more to beat the furthest distance.” Is she correct? Explain your answer.
d) What was the mean distance jumped?
- A hot liquid is left to cool in a science experiment. This graph shows how the temperature of the liquid changes as it cools.
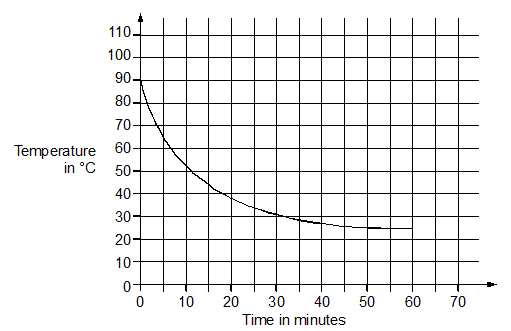
a) What type of graph is this?
b) How many minute does it take for the temperature to reach 40°C?
c) How many minutes is the temperature of the liquid above 60°C?
d) What happened after 47 minutes? Why do you think this happened?