This week in Maths we have been working on Data Handling, we used Google Sheets on our Chromebooks to input a variety of different data and present it in pie charts, line graphs and bar graphs.
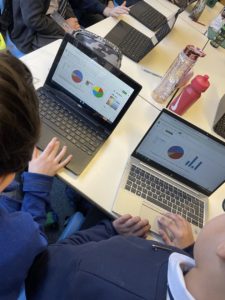
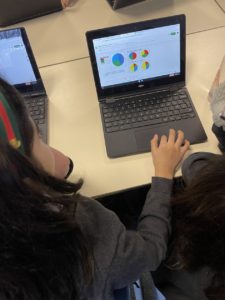
We explored using the x and y axis to plot different points, practiced inputting statistics and observe how changes impacted the graphs.