
Write the date and an appropriate title. Please answer the questions showing all working and answer in a sentence to show you have read, understood and fully answered the question. This should be completed by Friday 25th February. If you need help or a paper copy, please ask A.S.A.P.
- Here is a table showing the number of children at five schools.

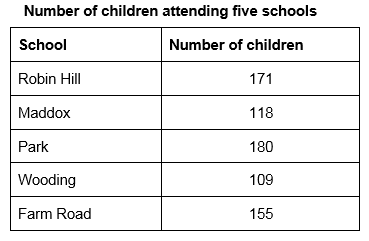
a) What type of chart is this?
b) How many more pupils does Farm Road have compared to Maddox?
c) All of the schools are visiting the local zoo on the same day. How many children will be there?
d) If the zoo charges £7 per ticket, how much money will they make on ticket sales?
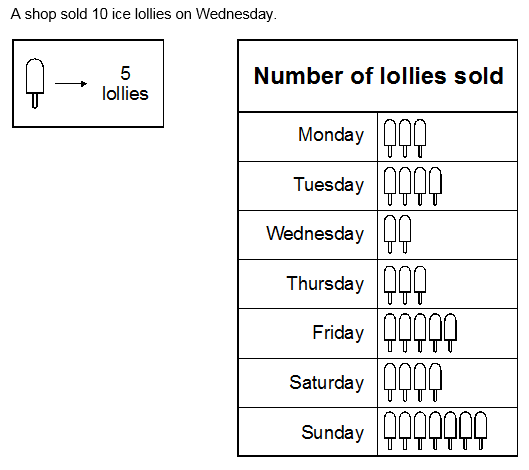
a) What type of chart is this?
b) How many ice lollies were sold on the two busiest days?
c) Which day sold the least amount of lollies? Why do you think this day was so quiet for sales?
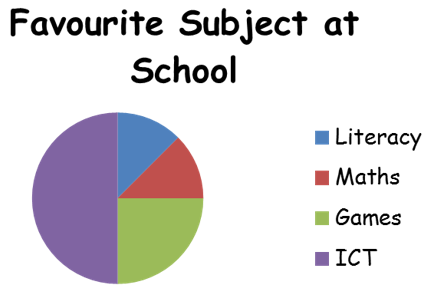
a) What type of chart is this?
b) 80 people were surveyed. How many people chose ICT as their favourite subject?
c) What fraction of people chose Games as their favourite subject?
d) What percentage % of people chose Maths as their favourite subject?
e) How many people chose Literacy as their favourite subject?