Orchard Primary & Nursery

Data Handling in P5

| 0 comments

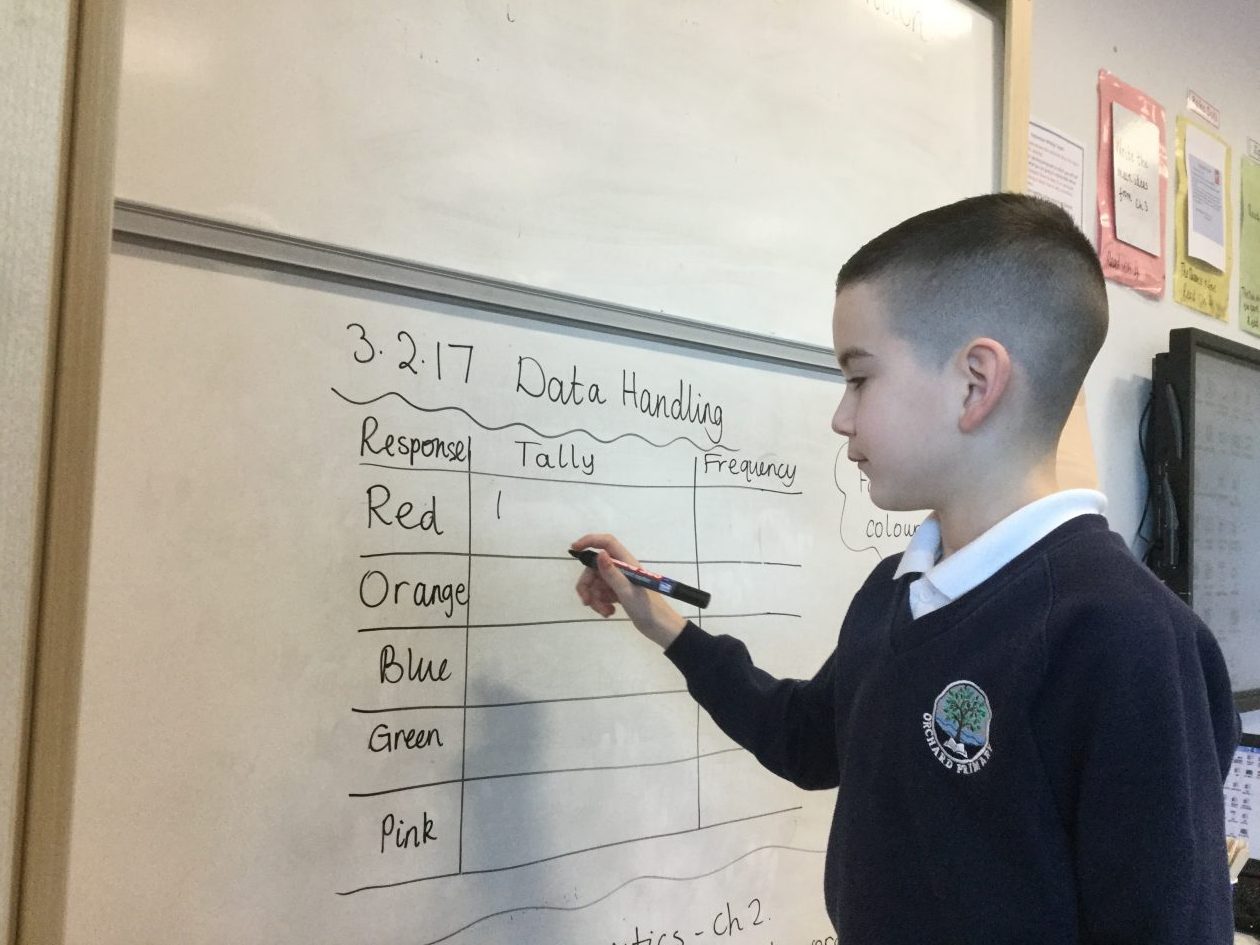
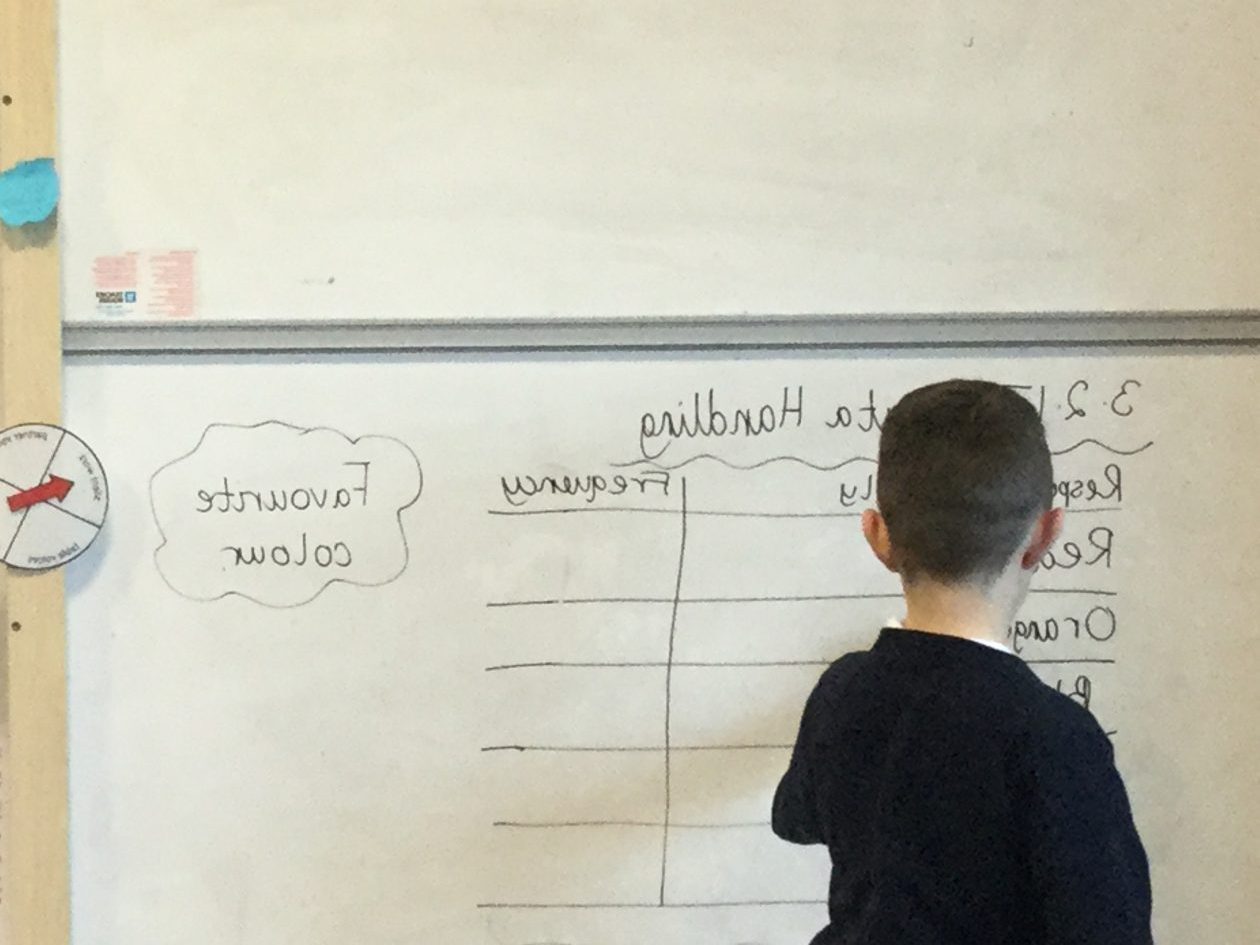
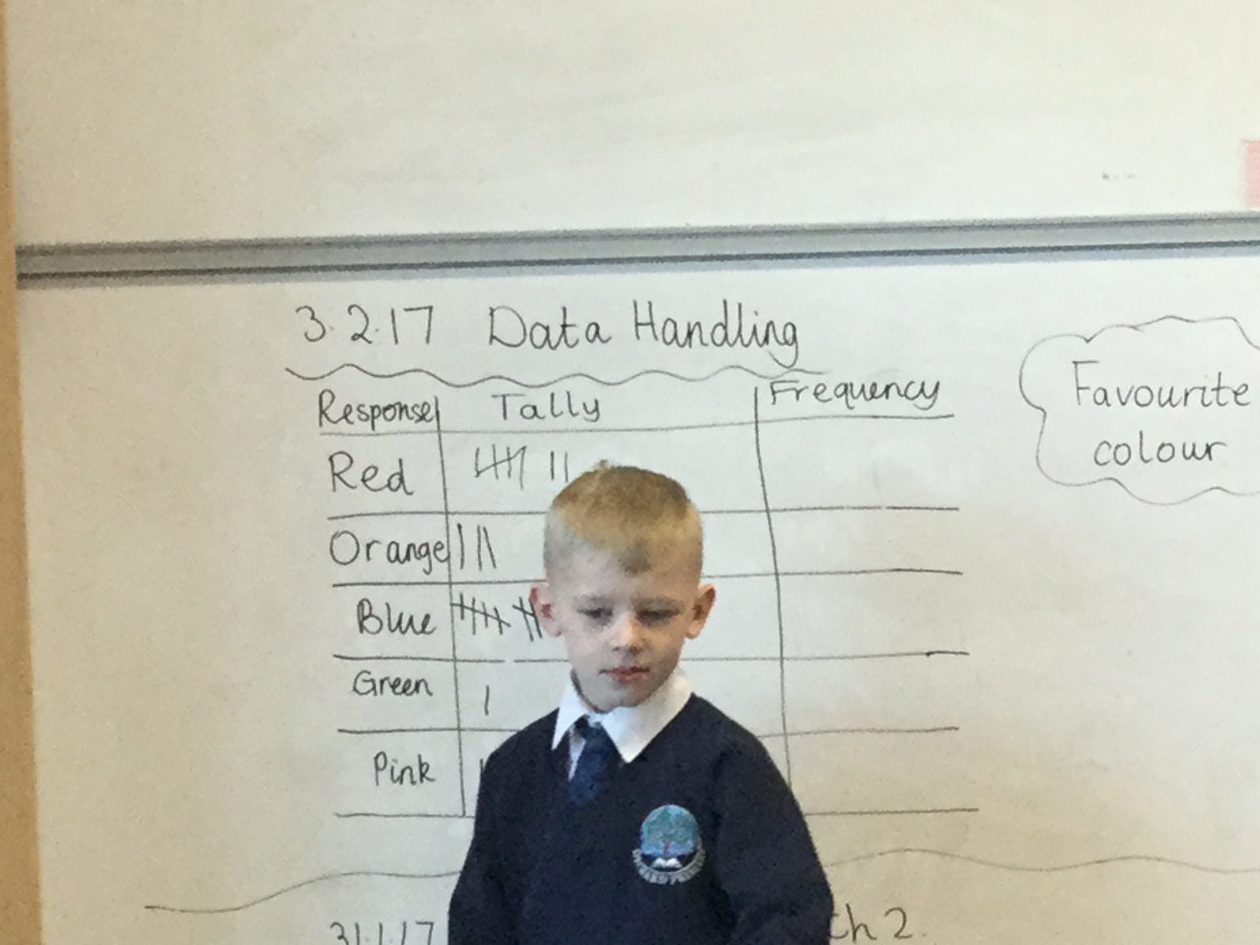
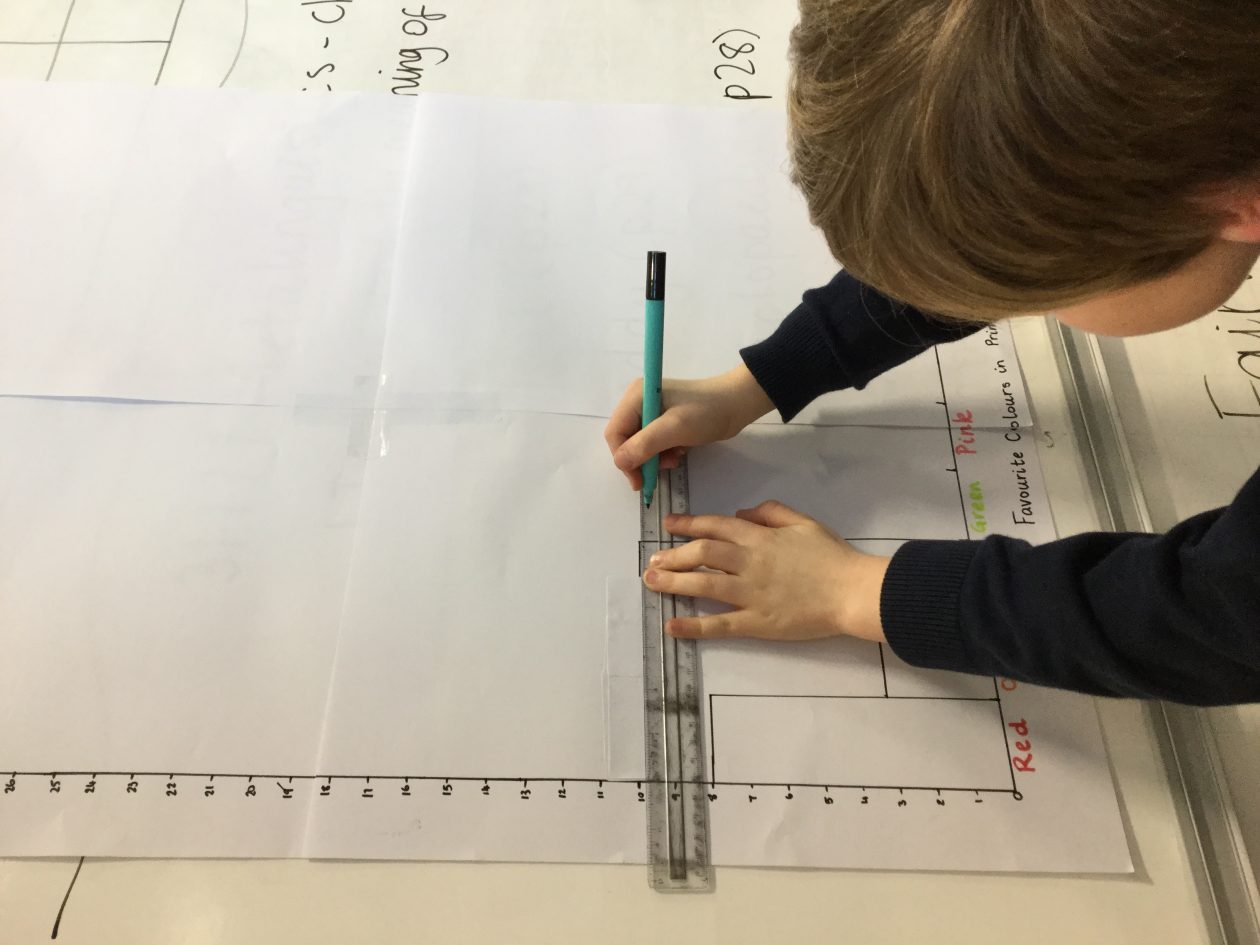
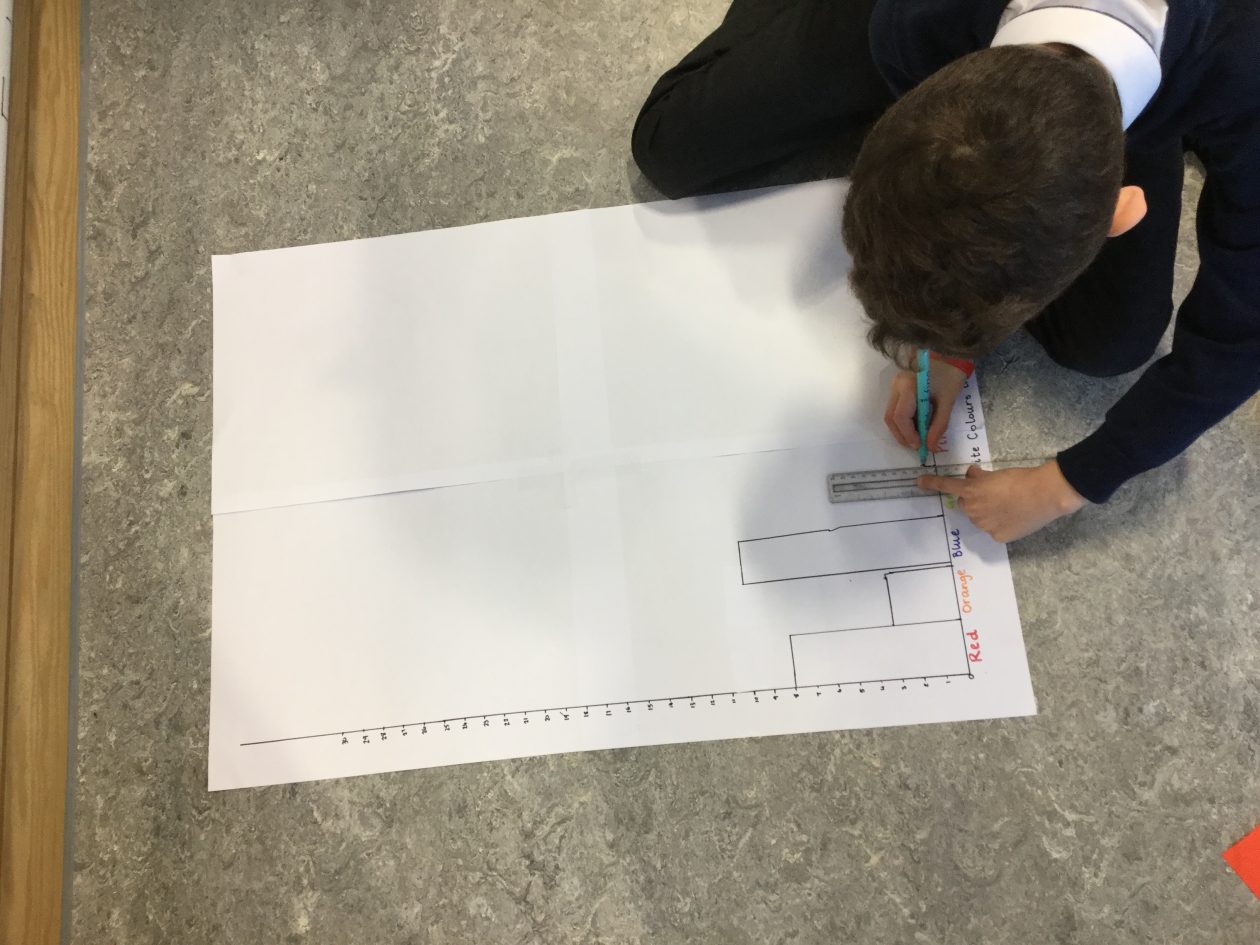
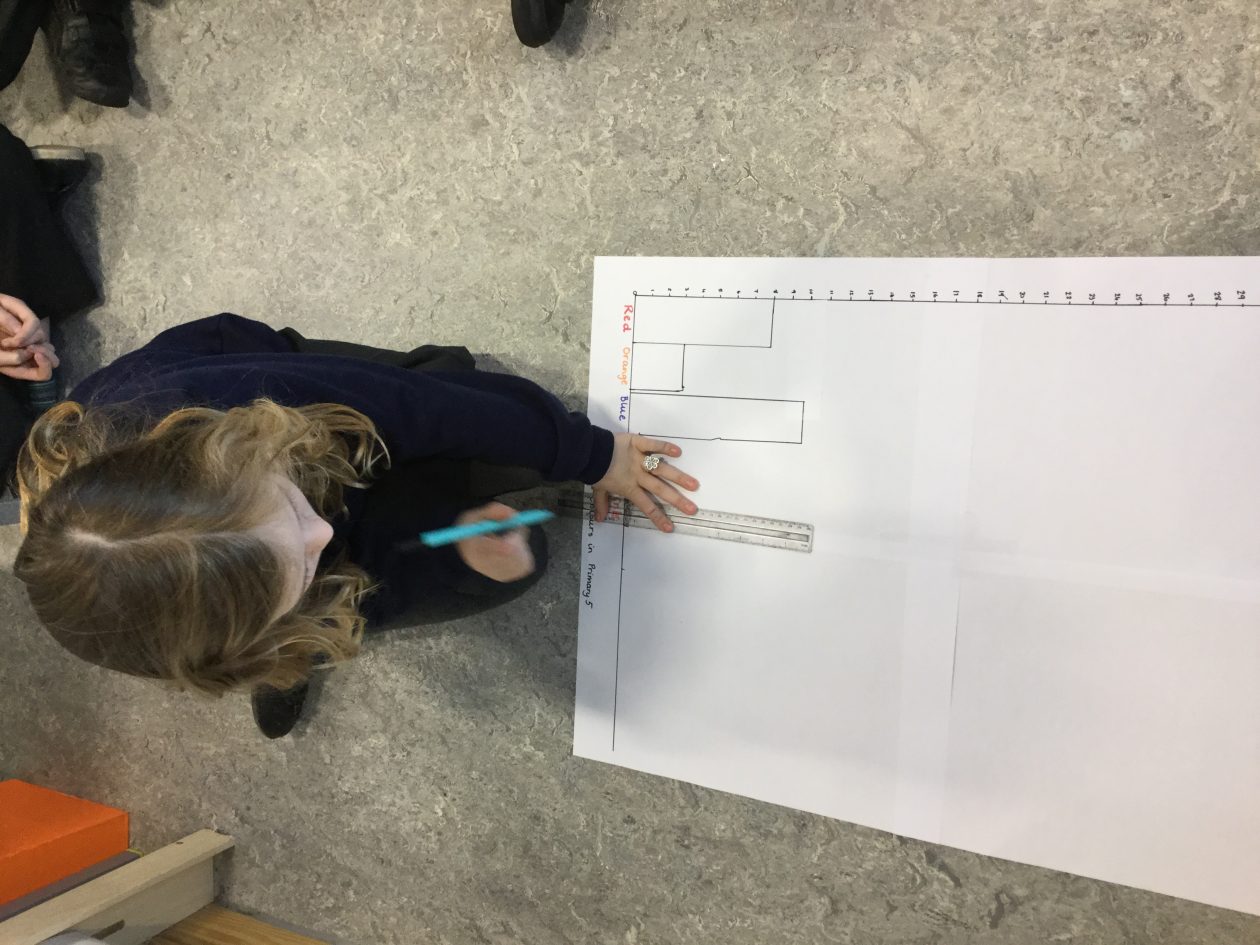
Boys and girls have been learning about Data Handling this week. They have learned about frequency tables and all had the opportunity to collect data and make their own. Today we looked at bar graphs and how we interpret them – we started off by collecting data on favourite colours and using this to create our own Class bar graph.

img_1193 img_1194 img_1195 img_1198 img_1200 img_1201

Leave a Reply

Required fields are marked *.


Report a Glow concern
Cookie policy  Privacy policy

Glow Blogs uses cookies to enhance your experience on our service. By using this service or closing this message you consent to our use of those cookies. Please read our Cookie Policy.