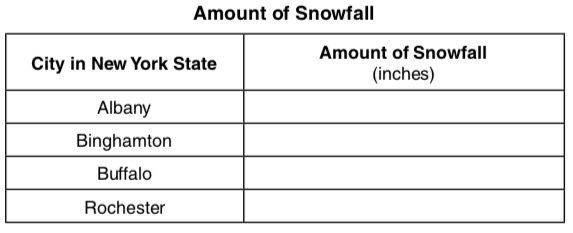
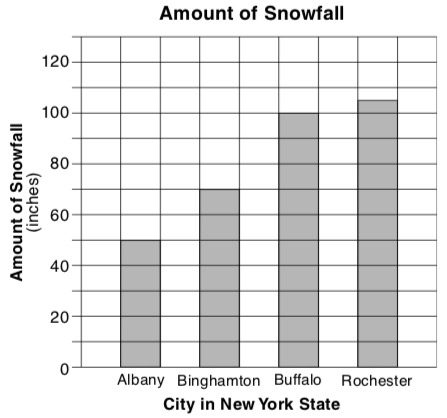
Science Skills Revision – Drawing Tables (Level 2A) Part 3 1. 2. 3. 4. 5. The graph below shows the total amount of snowfall that was measured during one winter in four cities in New York State, USA. Using the data from the bar graph, complete the data table below to show the amount of snowfall measured in each of the four cities.


