
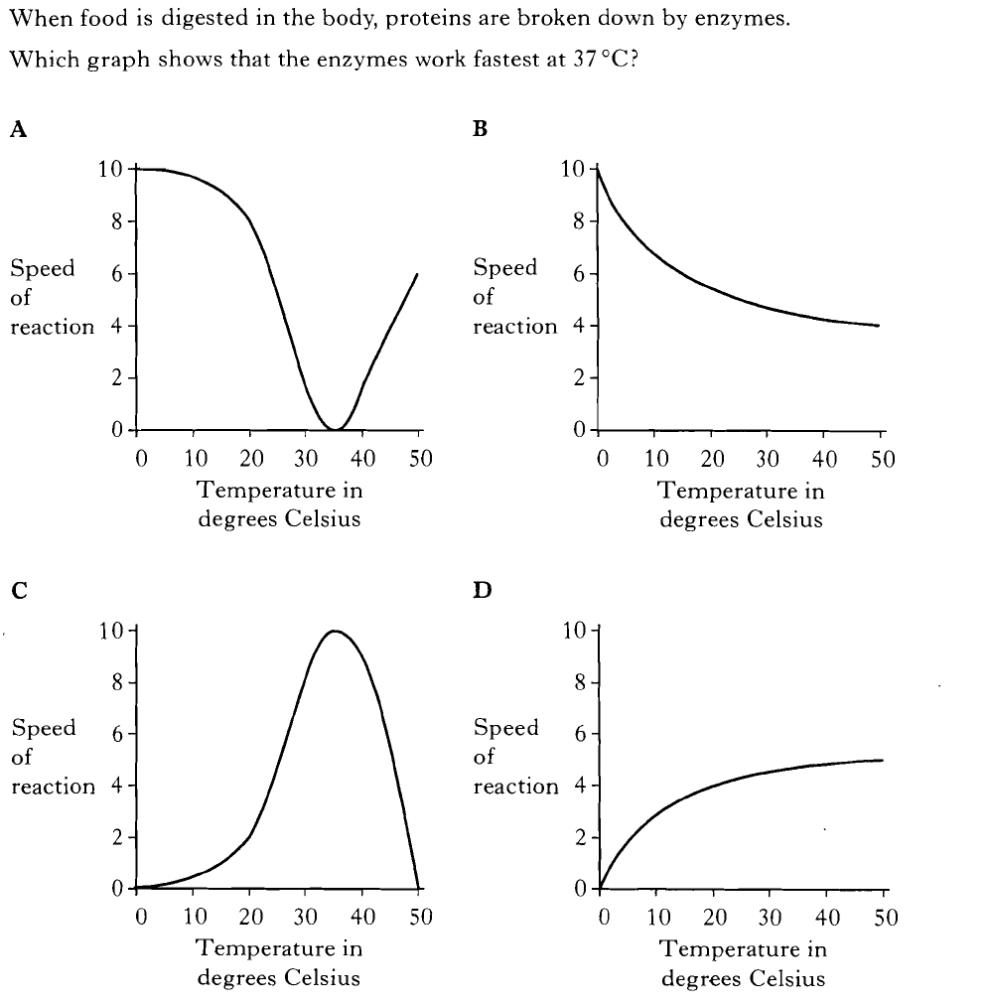
 |
 |
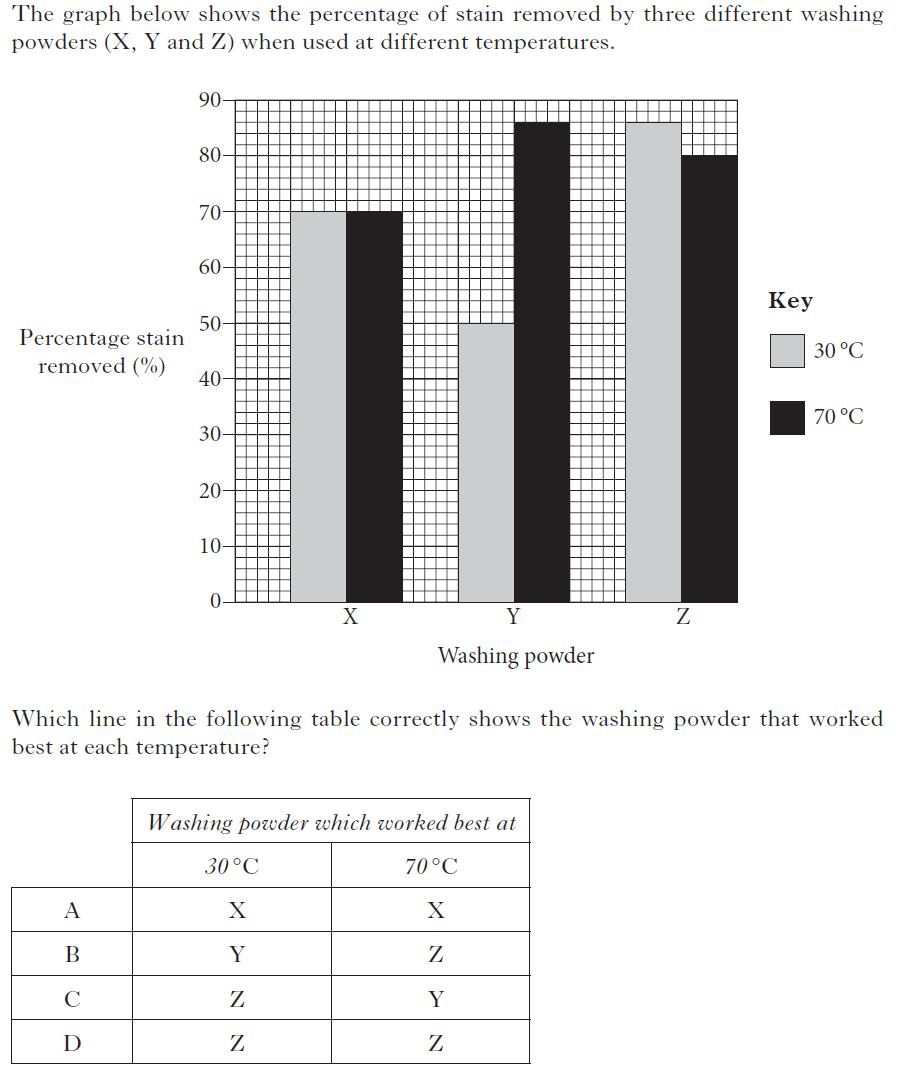
| 1. | |
 |
|
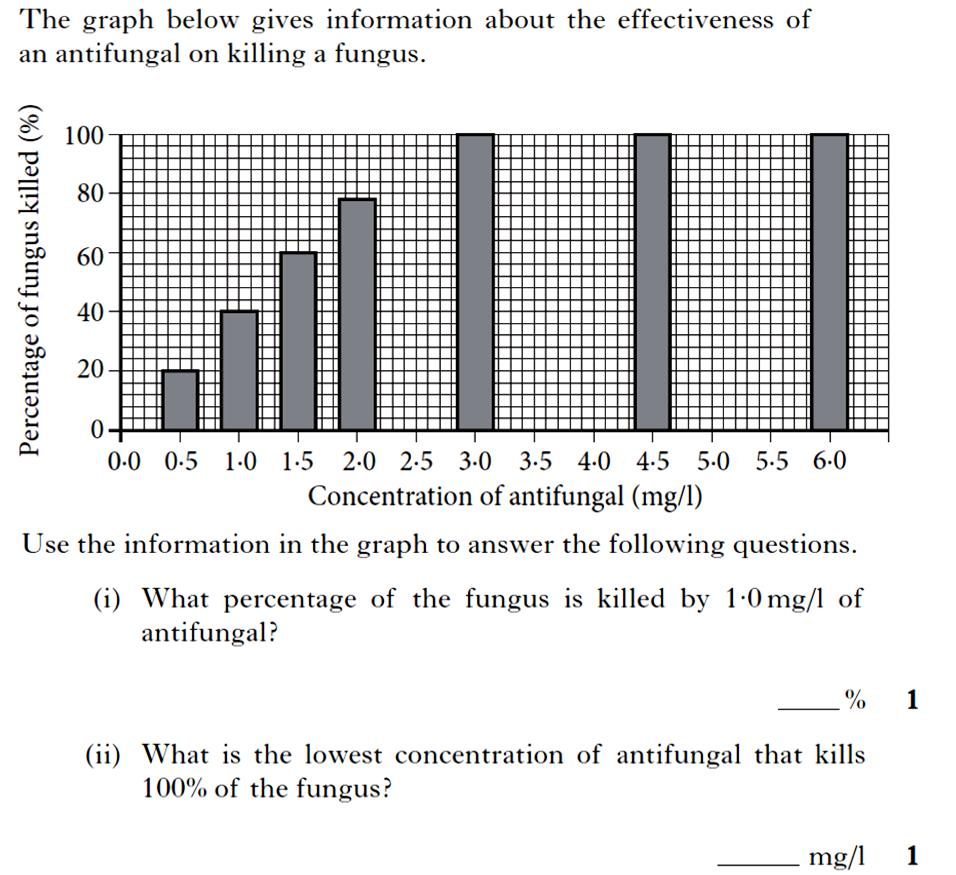
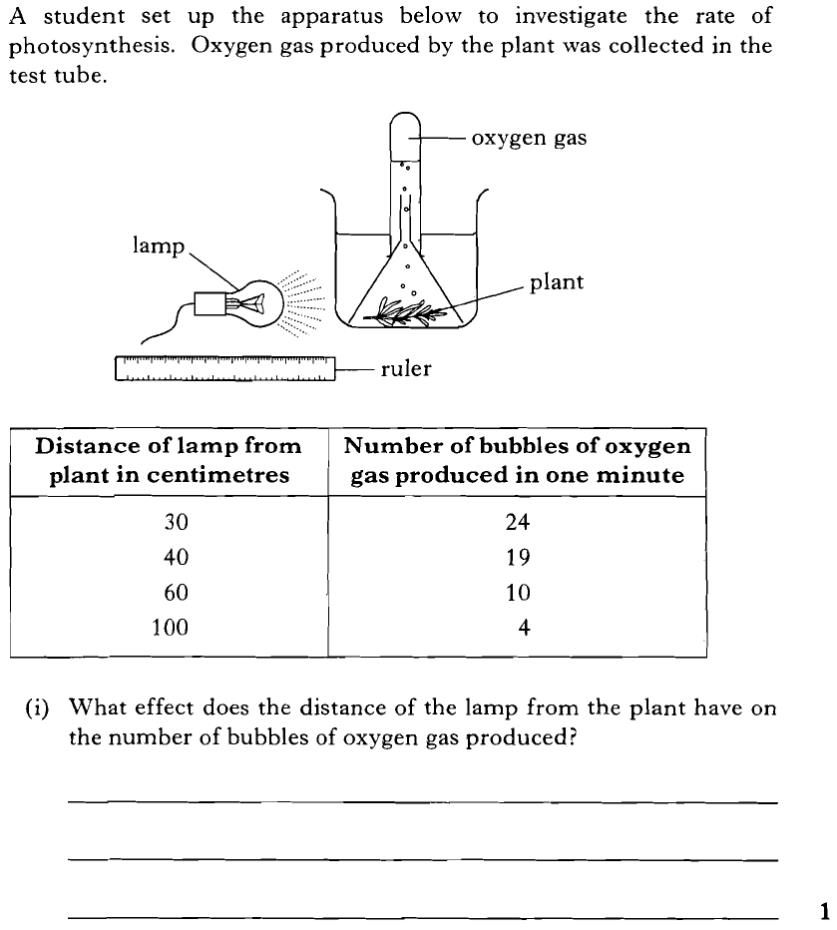
| 2. | |
 |
|
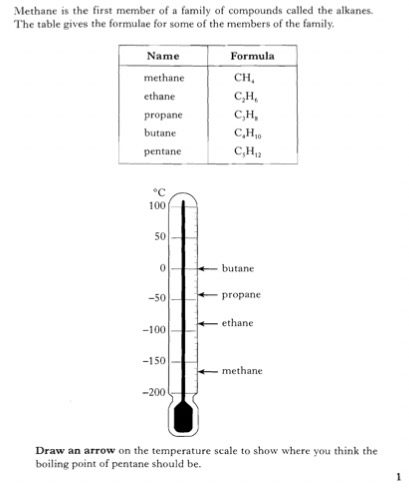
| 3. | |
 |
|
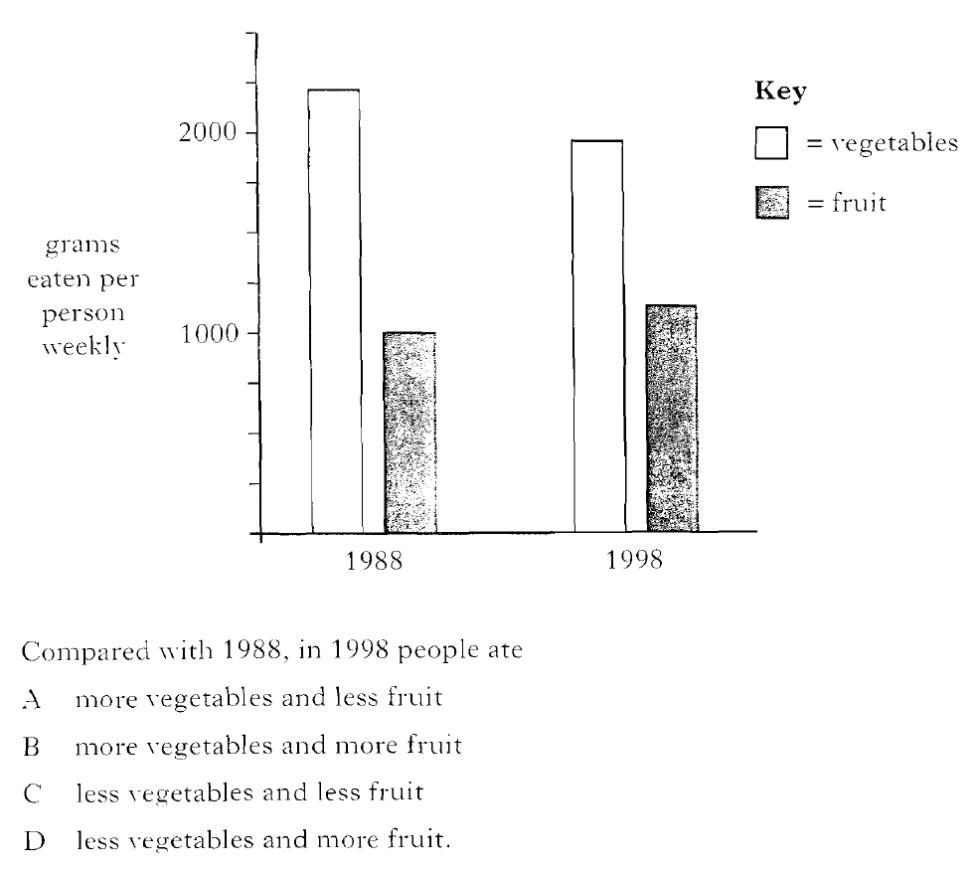
| 4. | |
 |
|
| 5. | |
 |
|
| 6. | |
 |
|
| 7. | |
 |
|
| 8. | |
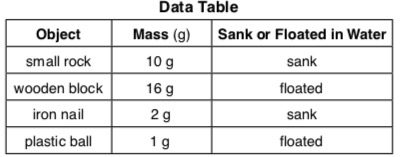
| A student predicted that all objects with a mass greater than 9 grams (g) will sink in water. After finding the masses of four objects, the student placed each object in a pan of water to determine if it would sink or float. The results of the experiment are shown in the data table below. | |
 |
|
| Based on the results shown in the data table, the student’s original prediction that all objects with a mass greater than 9 g would sink was incorrect.Describe the evidence from the data table that proves that the prediction was incorrect. [1] | |
| 9. | |
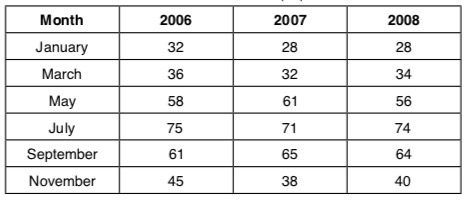
| The data table shows some average monthly rainfall, in mm, at Edinburgh Airport measured over a three year period. | |
 |
|
| a) | Identify the month with the highest average rainfall (mm) for the three years. |
| b) | Estimate the most likely average rainfall for April 2008 |
| 10. | |
The diagram below shows a spring scale.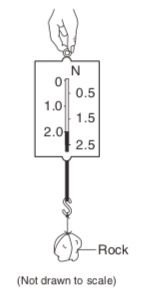 The spring scale is being used to measure the rock’s |
|
 |