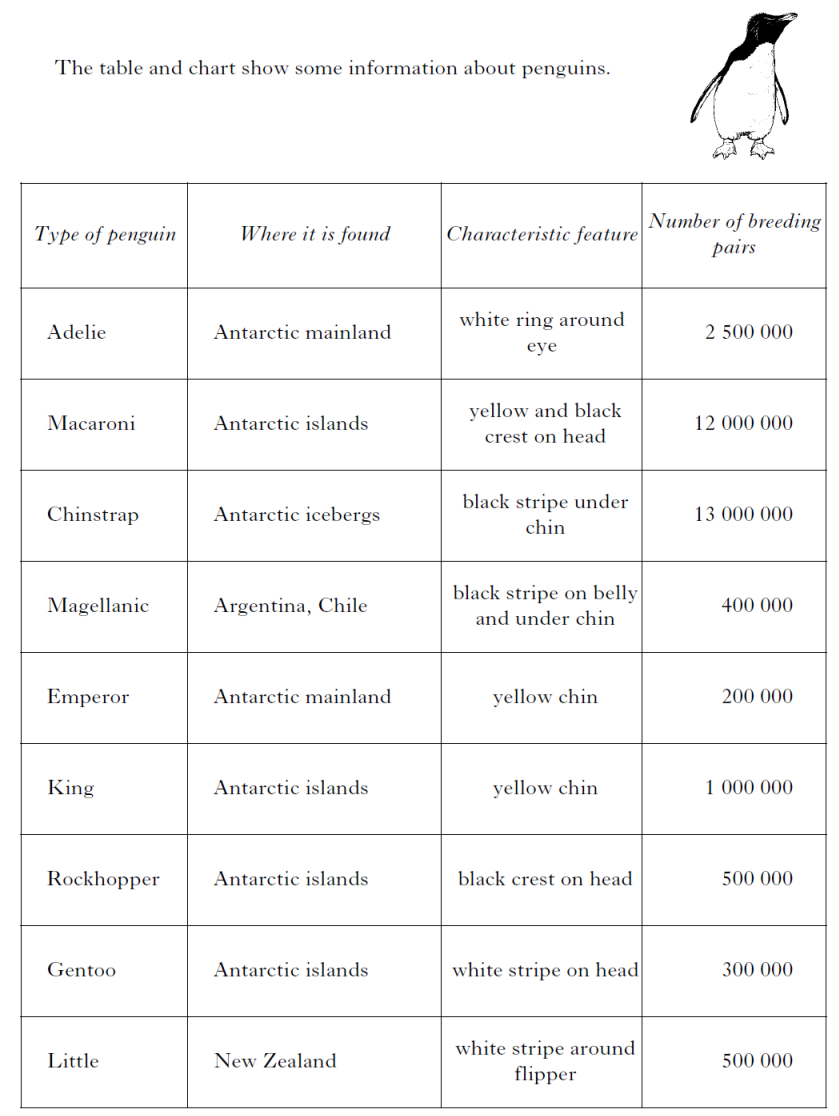
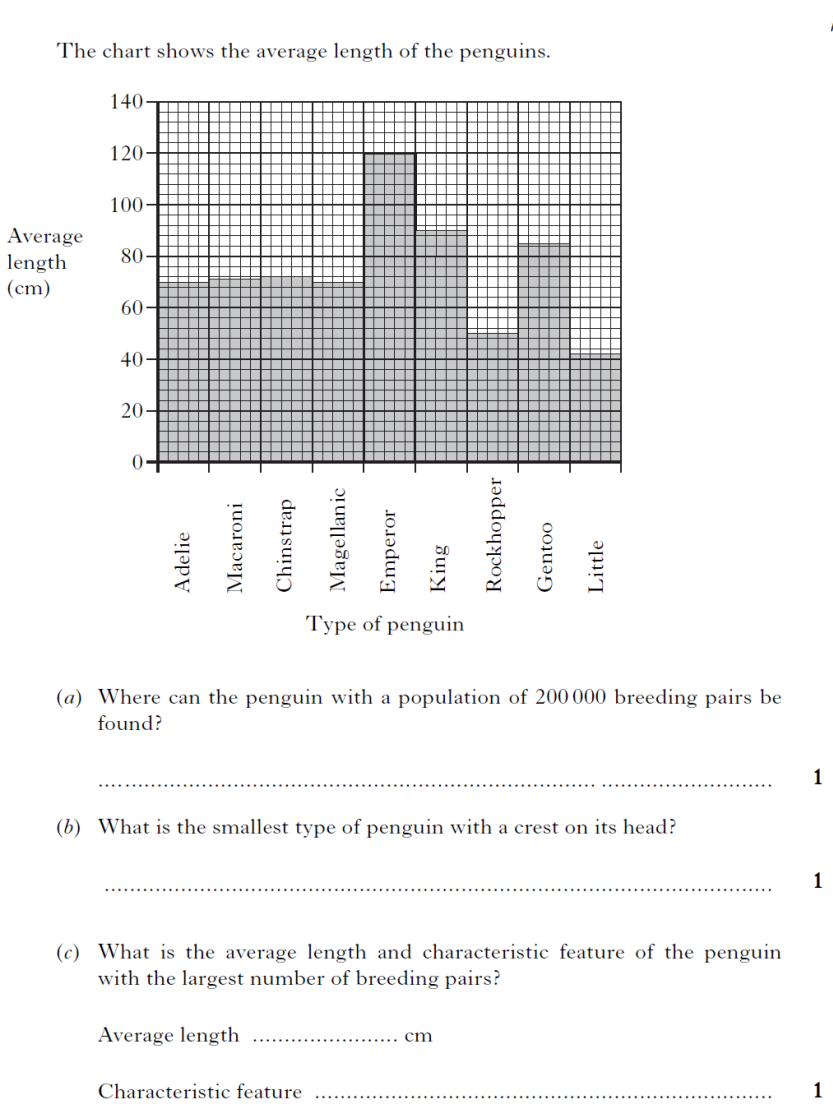
| 1. |
|
|
  |
| 2. |
|
|
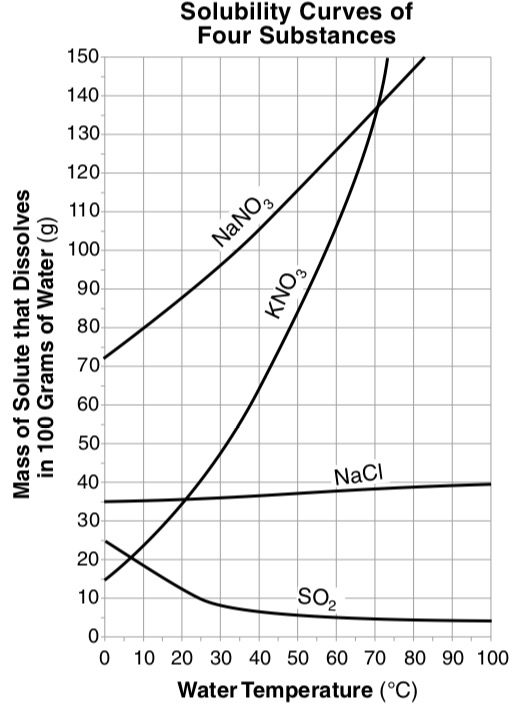
The graph below shows how water temperature affects the solubility of four different substances. |
|
 |
|
The solubility of which substance is least affected by the temperature of the water?
A – NaNO3
B – KNO3
C – NaCl
D – SO2 |
| 3. |
|
|
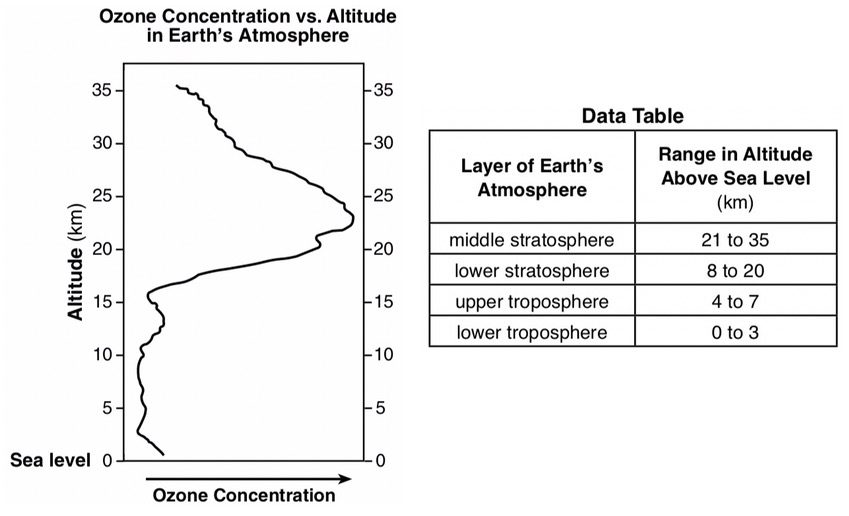
The graph shows the change in ozone concentration with altitude in Earth’s atmosphere.
The data table shows the average height range above sea level, in kilometers (km), for the different layers of Earth’s atmosphere. |
|
 |
|
Which layer of Earth’s atmosphere contains the highest concentration of ozone? |
4.
|
|
|
The graph shows the position (distance from home) of a bicycle rider on a 42-minute trip.
Letters A through E are time intervals during the trip.
The key defines the length of each interval.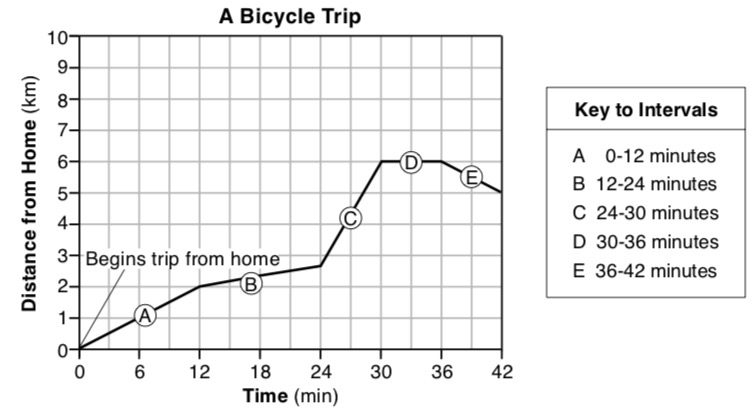 |
| a) |
|
|
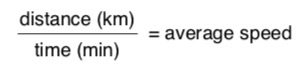
Use the equation below to calculate the bicycle rider’s average speed in kilometers per minute for the first 30 minutes of the trip.
|
| b) |
|
|
Describe how the graph shows that the rider stopped during time interval D. |
| 5. |
|
|
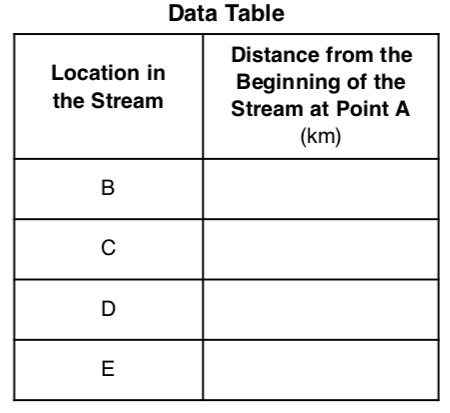
The graph represents the changes in elevation in meters (m) of a stream.
Letters A through E represent locations in the stream at different distances in kilometers (km) from point A where the stream begins. |
|
 |
|
Complete the data table below, using data from the graph. Fill in the distance from the beginning of the stream to each lettered location along the stream.
|


