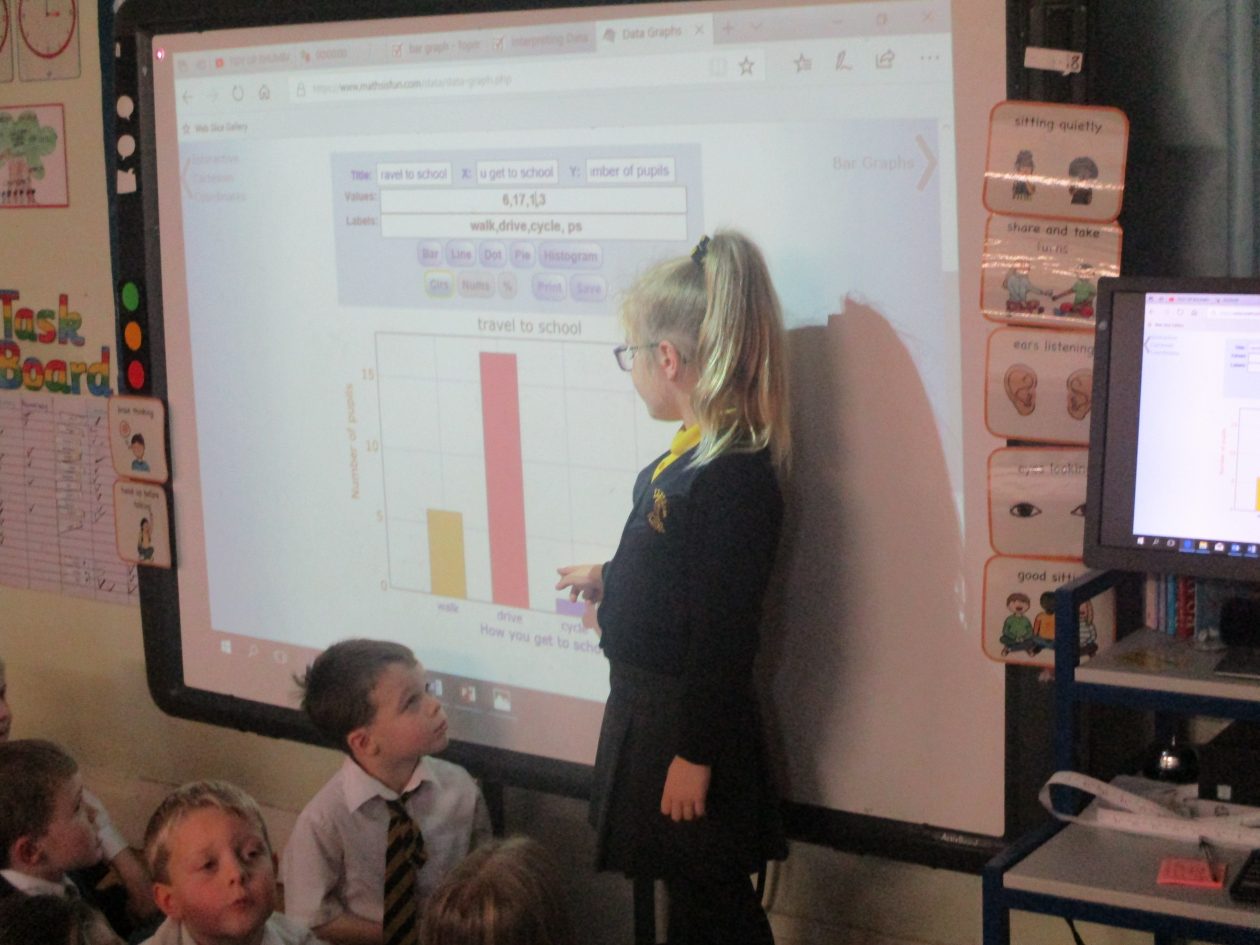
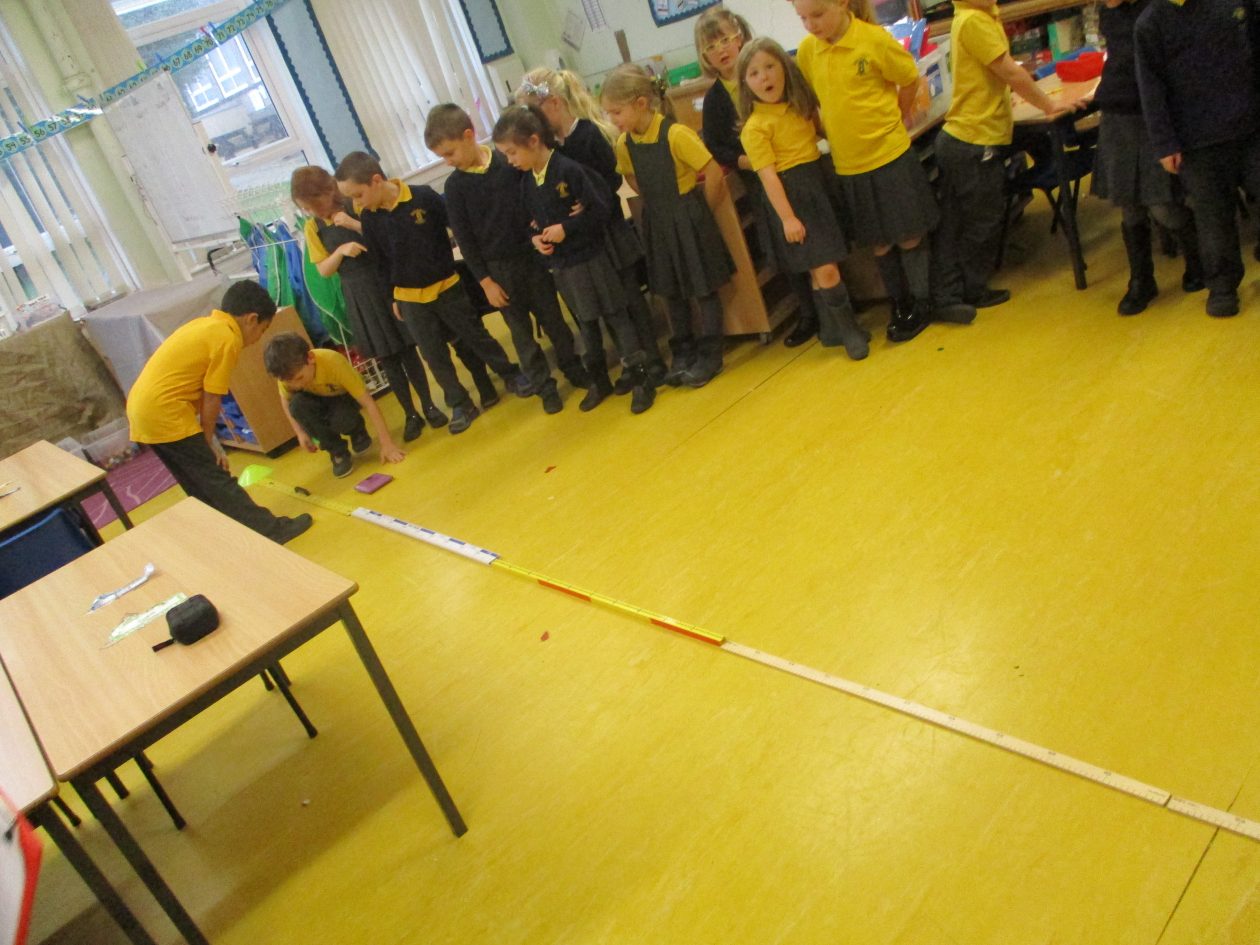
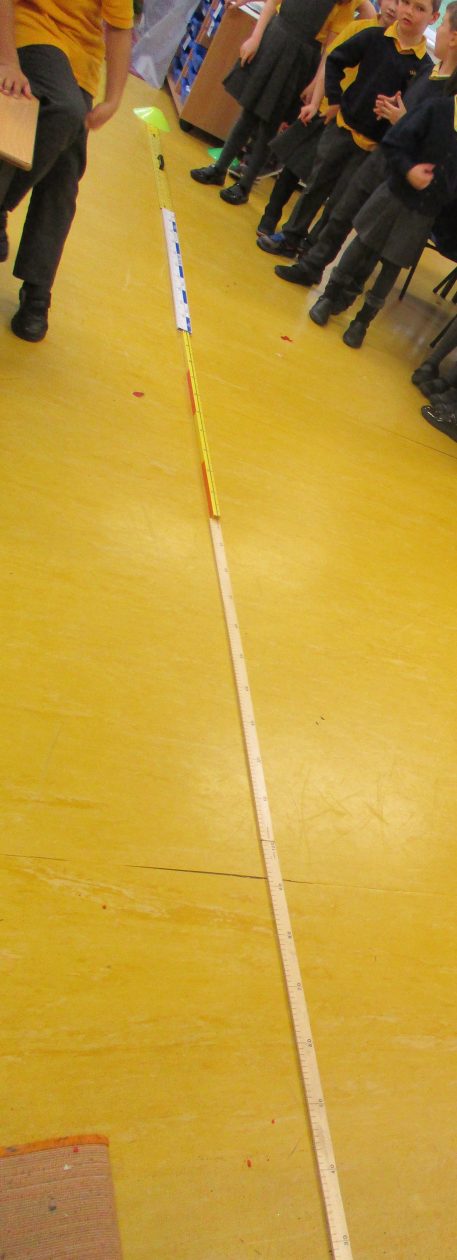
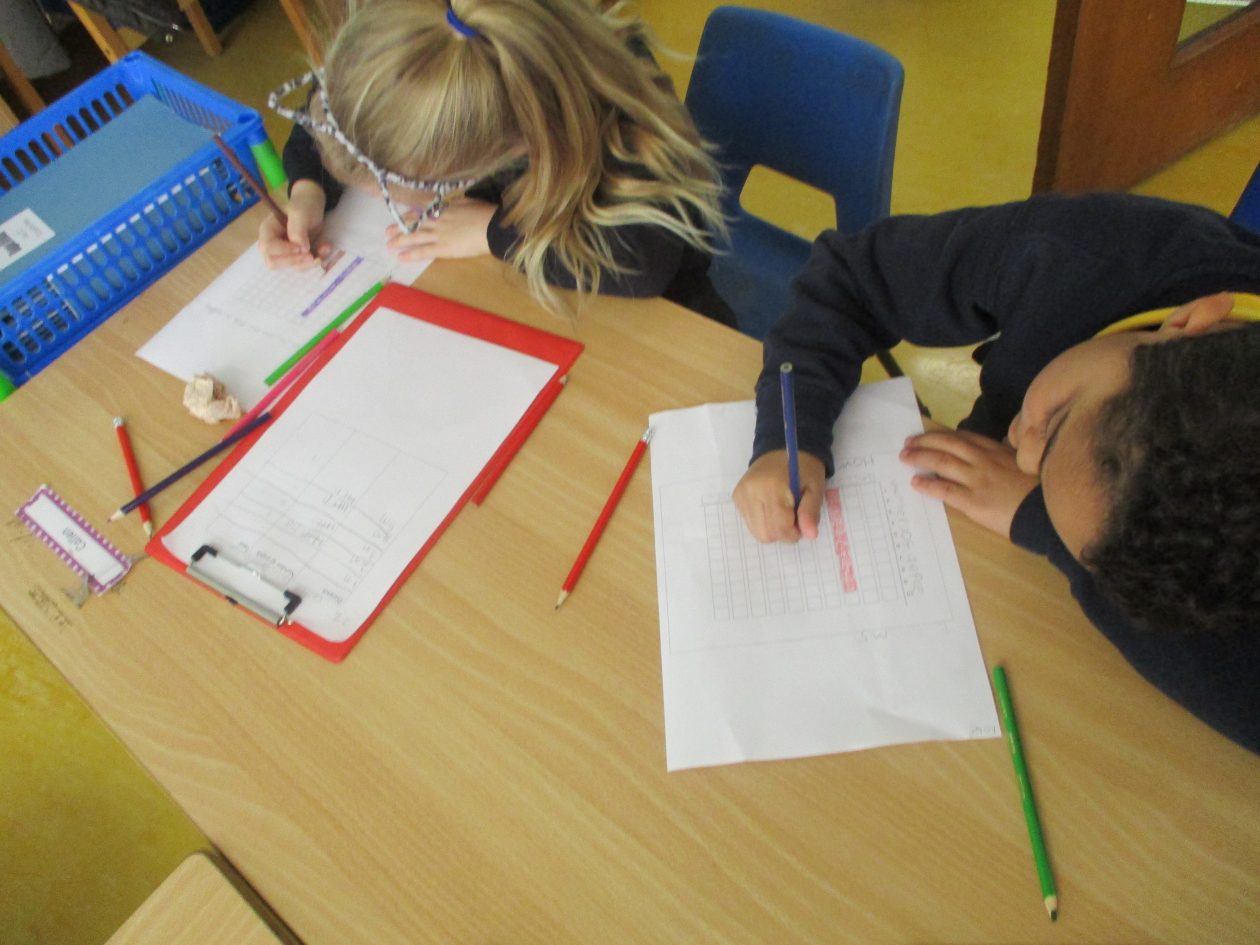
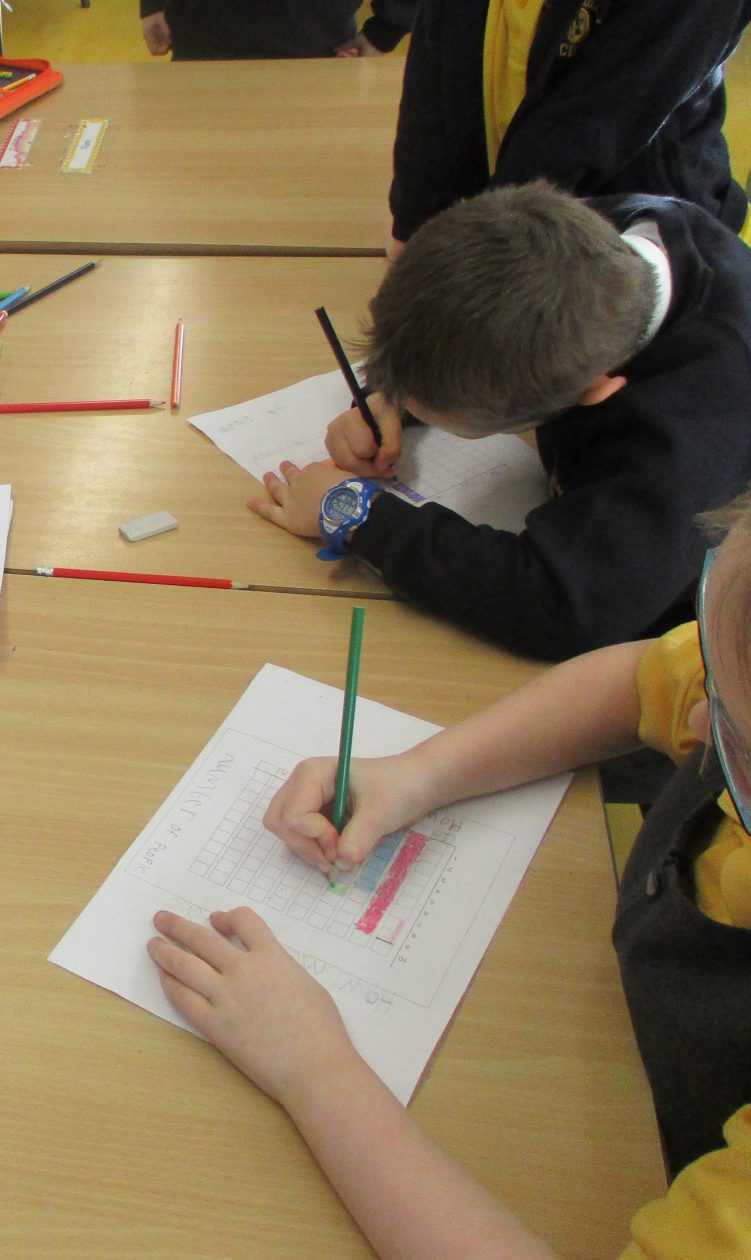
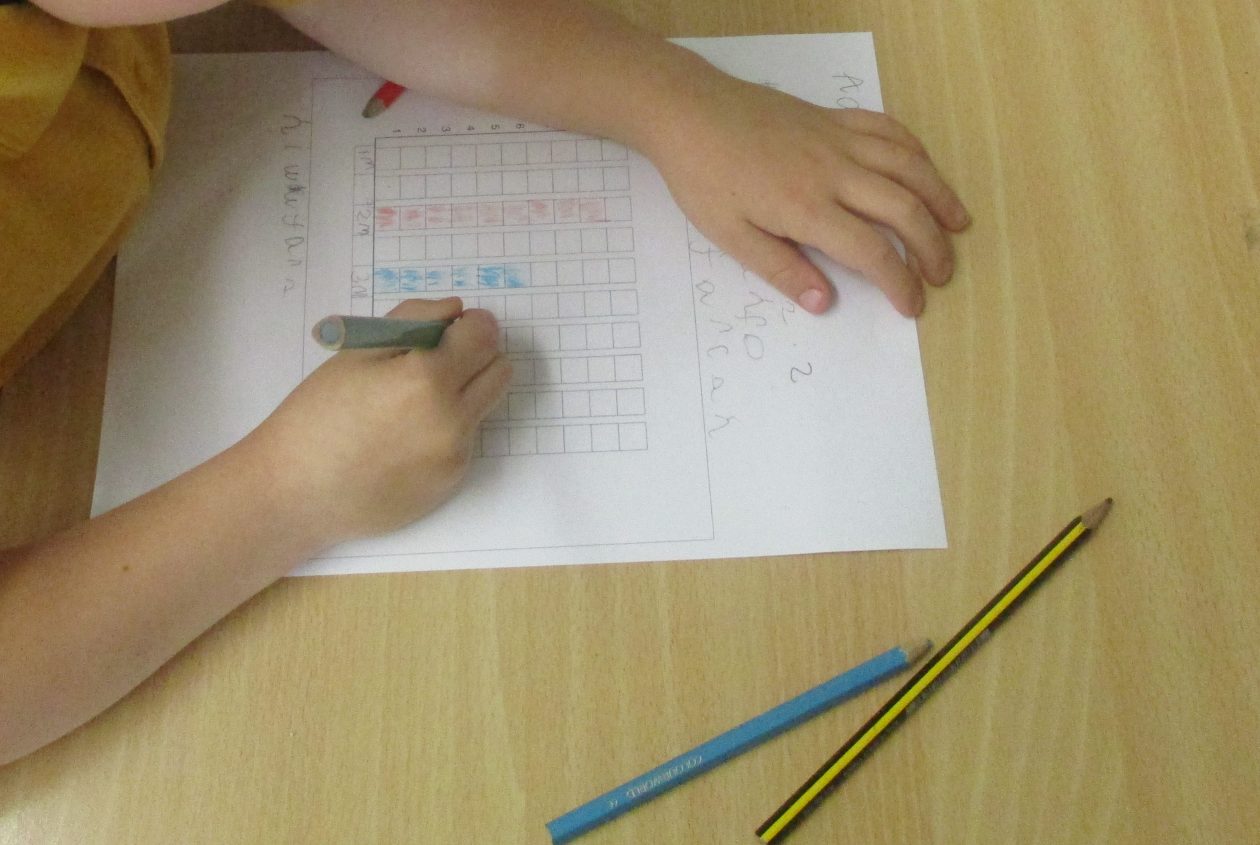
Primary 2.2 have been learning about data handling. First, we looked at how we can use the information from a tally chart to make a bar graph. We discussed what information we could find out by reading the bar graph. Then we decided that we could make our own bar graph. We used our knowledge of measurement to work out how far each of us could throw a beanbag. After recording the results in our tally chart we labelled and coloured in our own bar graphs.
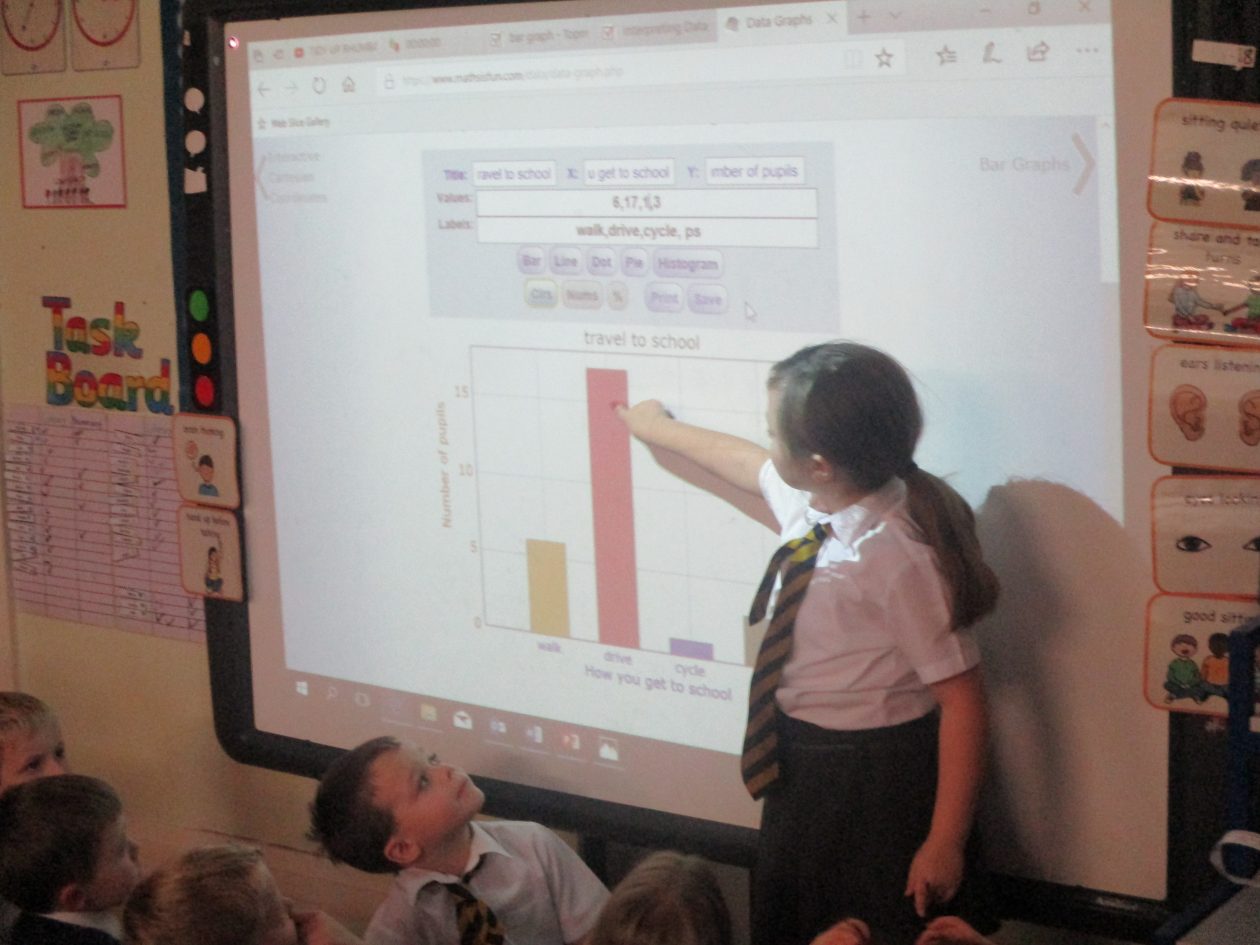
‘You have to have lines, the number of people, the names of what you have to ask at the bottom and a title’. Callen
‘You know the big one is the one the most people have went for because it is the biggest one’ Carrie
‘It’s like little bars and you can see what one has the most.’ Aaron L
‘You have to have boxes when you are making a bar graph. These show the amount of people.’ Annabelle