Hello again everyone. Hope you enjoyed your writing task this morning!
Don’t forget to listen on to a story at 11.00 with David Walliams
http://www.worldofdavidwalliams.com/category/elevenses/
Today we will continue with our work on Data Handling. Last week we used information we collected about creatures at the pond and then shapes to organise into a table.
Today we are going to look at pictograms or pictographs. This is another way of organising and displaying information to make it easier for us to to read.
Watch and listen to the clip below as coloured blocks are used to make a pictograph.
- Think about the information in the pictograph
- Ask a family member to help you use the pictograph to answer the following questions:
- Which colour is the most popular?
- Which colour was least popular?
- How many green and yellow blocks are there altogether?
- How many red and blue blocks are there altogether?
- Now look at the pictogram below.
- Think of some more questions could you ask about the information shown in the pictogram?
- Ask a family member your questions

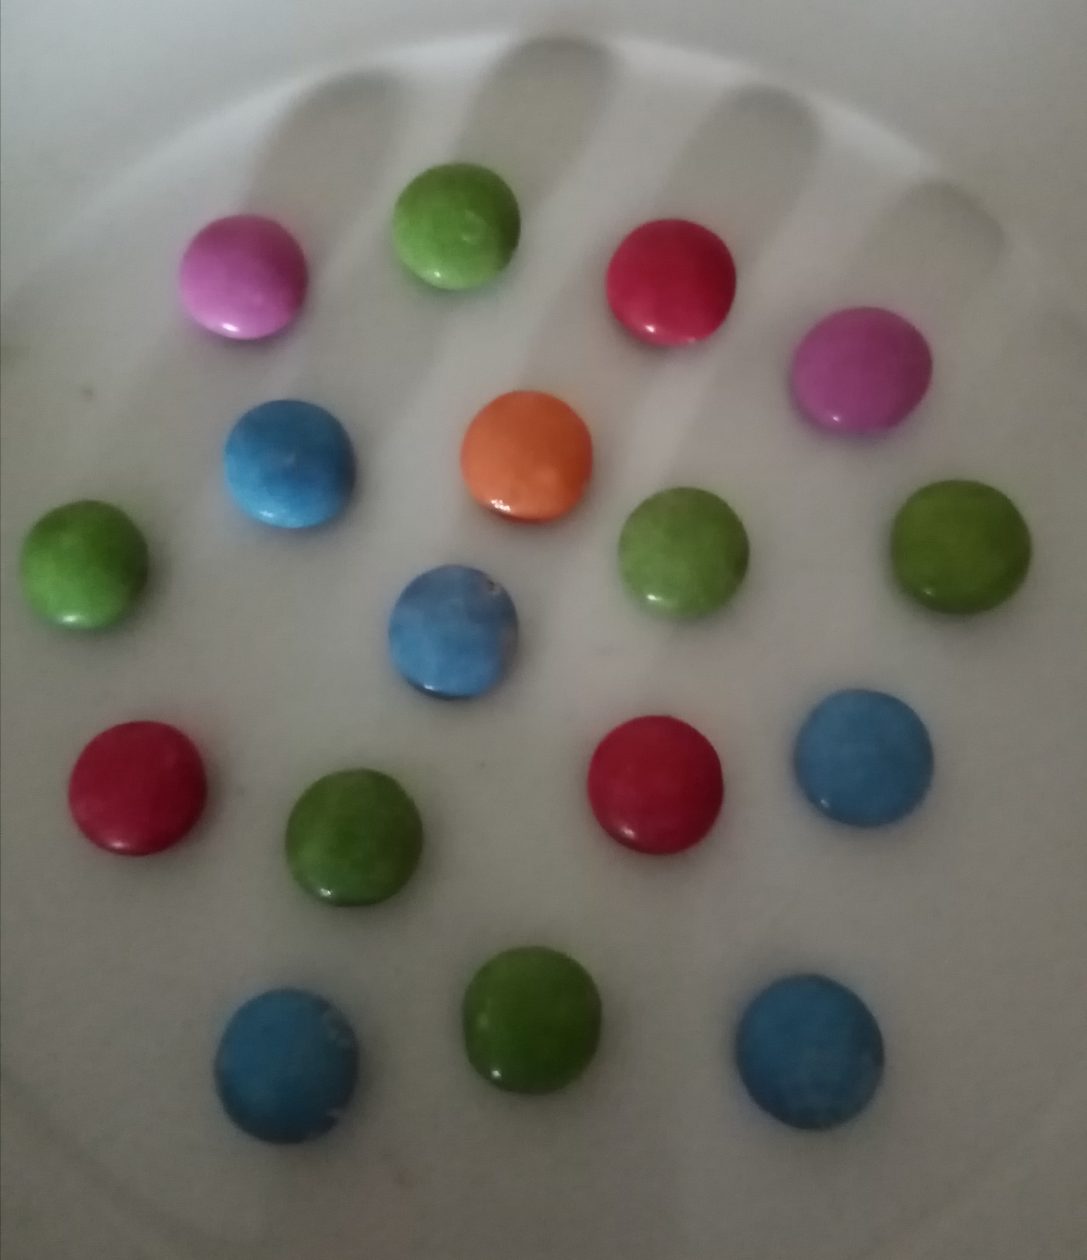
- Now look at the smarties below
- Have a go at constructing a pictogram of your own to show the different colours
- Record it in your jotter
- Or you could use real smarties or other sweets to create a pictogram of your own
- Think of some questions you could ask a family member about your pictogram
- Finish off by answering questions on some simple pictograms
- You can choose pictograms showing pets, fruit, ice cream and lots more
http://www.wldps.com/gordons/Pictograms.swf
- Choose the Vertical Pictograms option Unit = 1
Have fun!
Mrs Topping and Mrs Bryce