Hello again everyone!
Don’t forget to tune in to Elevenses with David Walliams at 11.00am
http://www.worldofdavidwalliams.com/elevenses/
- Today we will continue with Data Handling
- Data handling means different ways of collecting, organising and displaying information.
- Can you remember any of the ways we sorted information last week?
- We sorted by shape, colour and size
- What ways did you think of to sort the animals in your Education City task?
We can sort information by looking at a picture
- Watch and listen to the clip below
- We can organise this information into a table like the one shown below.
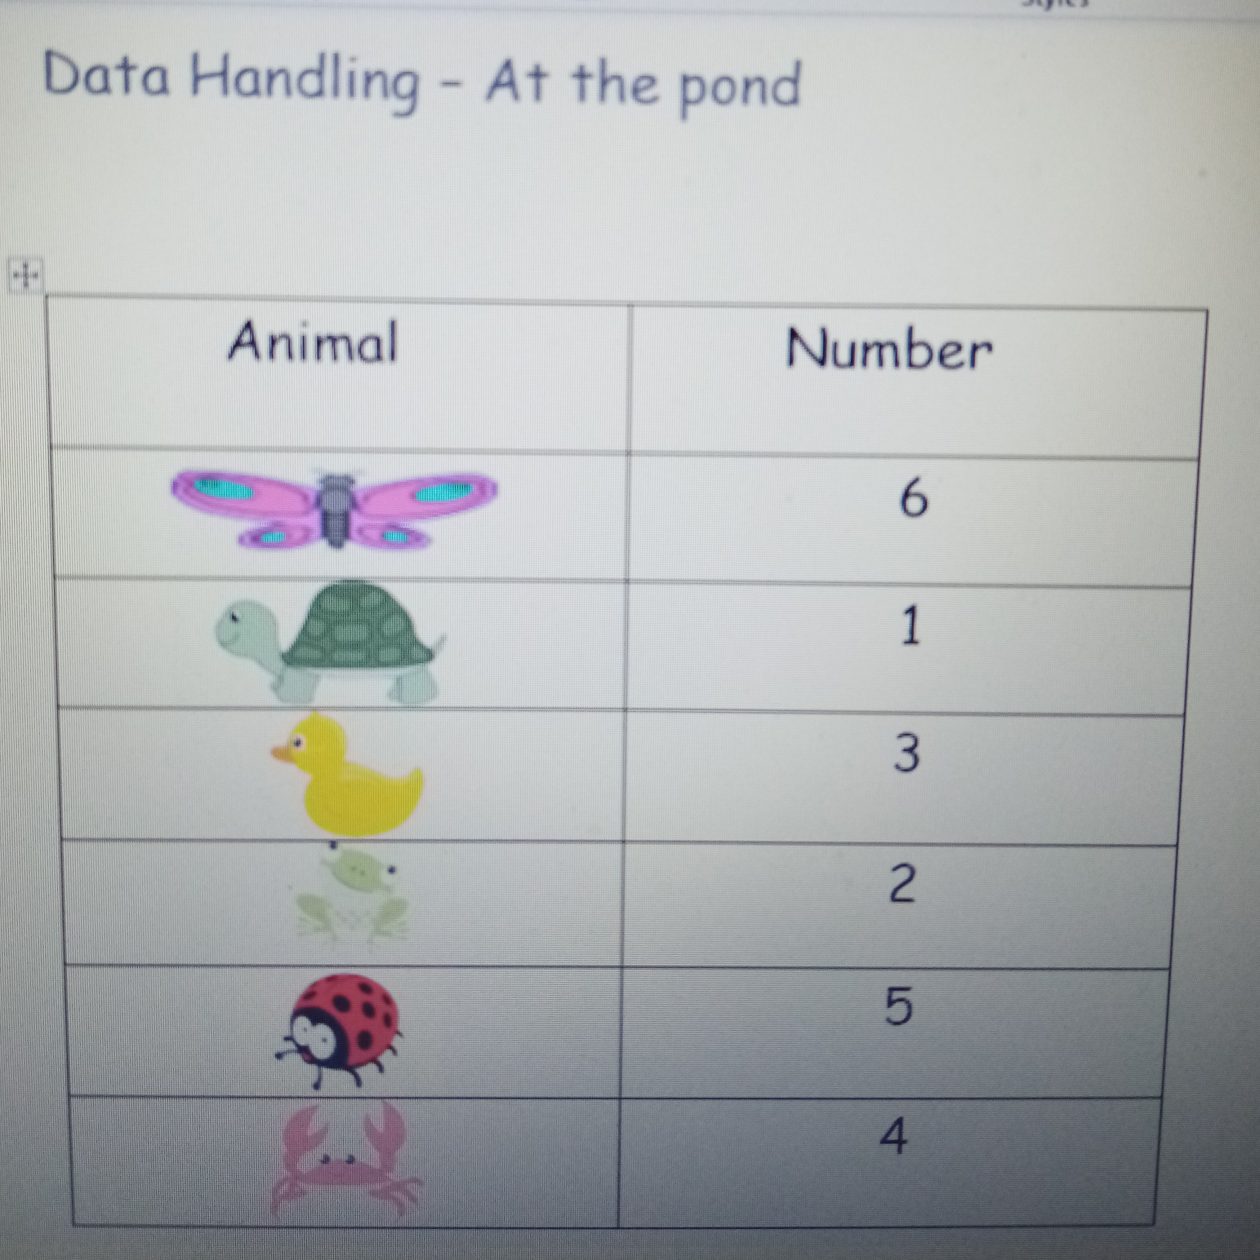
- We can use this information to ask and answer questions:
- What is the most popular animal at the pond?
- What is the least popular animal at the pond?
- How many ducks and frogs are there altogether?
- How many animals are there altogether? etc.
- Now take a look at the picture below
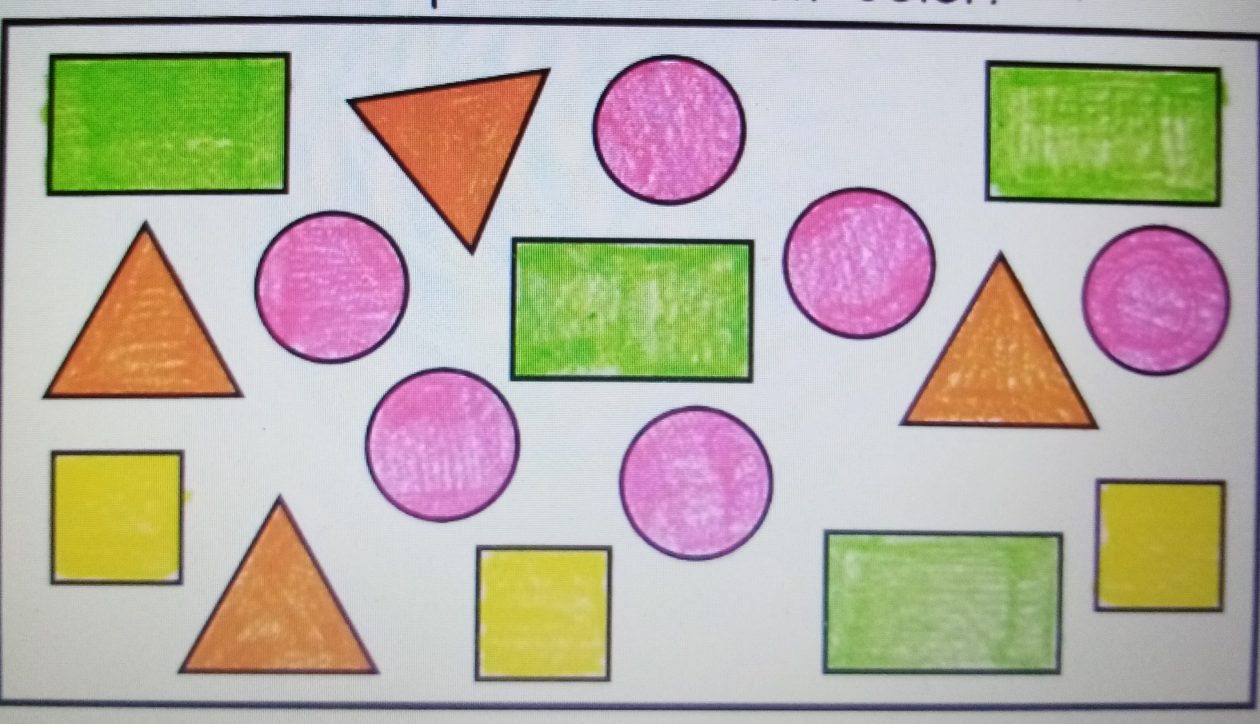
- How many of each shape can you count?
- Use the information to draw and complete a table of your own in your jotter
- Now get a family member to ask you some questions about your table
- To finish off try to think of a way to sort/organise some of your toys
- Sort them and take a photograph or draw a picture to share with us by email or by posting it on the blog
- You could even make a table to show how you have organised them
Next week we will learn how to use information to construct a pictogram
Mrs Topping and Mrs Bryce