
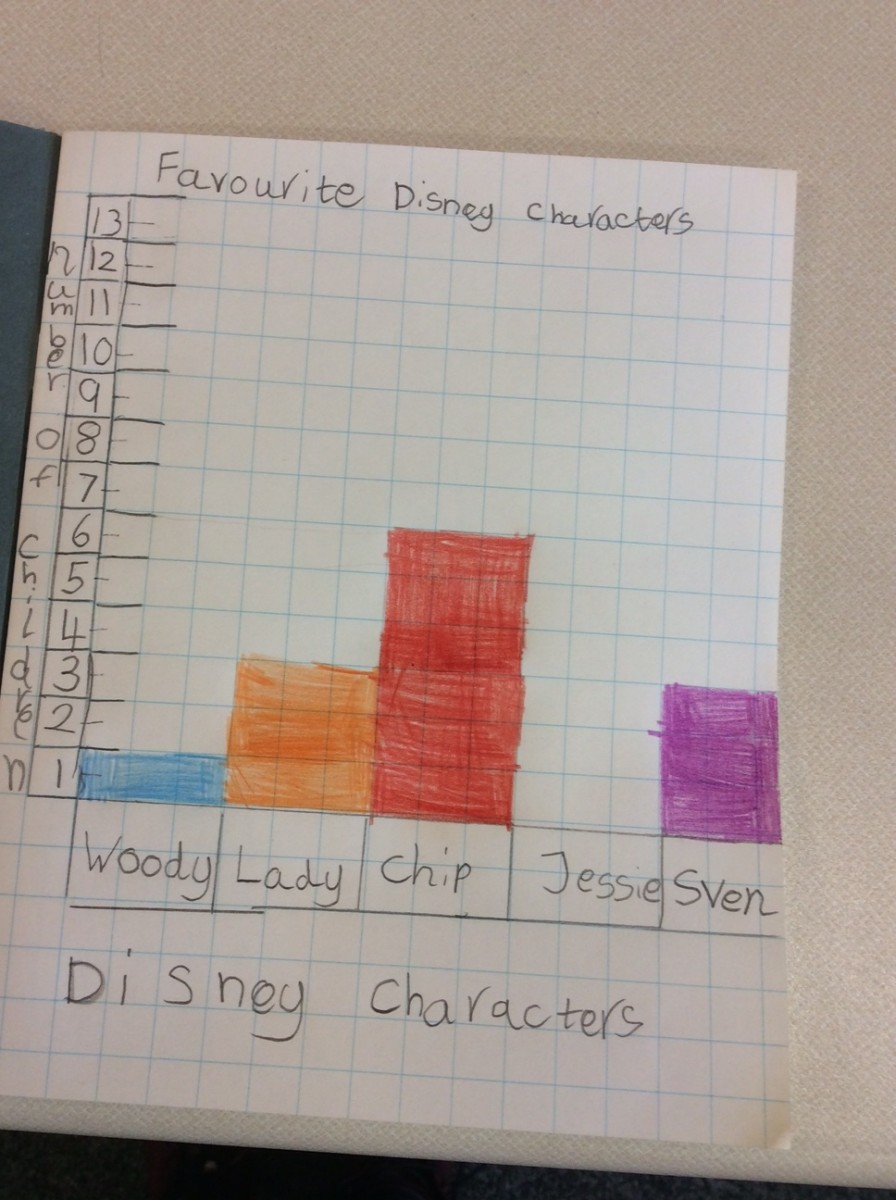
 In data handling we go round and ask people what their favourite animals or films are. While you go round asking people you write down what they say. When you have all the information you make a chart to show what each person likes. There are lots of charts you could make a pie chart when you make a pie chart you draw a circle and divide it in to how much people liked the thing and when you make a bar chart you put numbers at the side so you know the number of each thing that the people choose and at the bottom you write the things you wanted the people to choose from.
Data Handling
April 19, 2016 | 0 comments