Today Hester’s dad Patrick came in to check on the chicks. He taught us how to do bar chart, we used this to measure the chicks 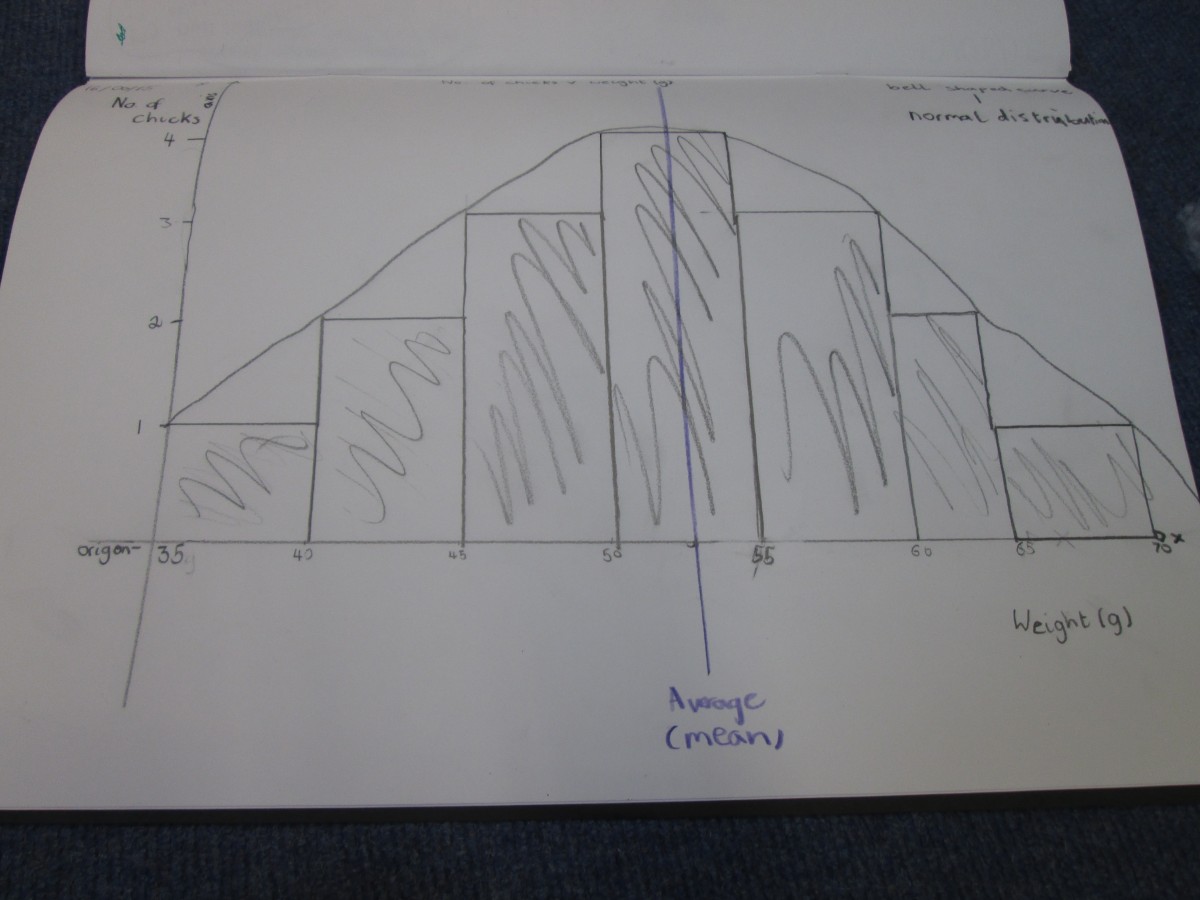 growth. He told us
  that the x axis is is across and the y axis is up. He also told us a joke that the x axis is a cross! We learnt how the graph works. we made are graph 1 to 4 up the way and 35 to 70 across the way. We weighed the chicks in grams. Because we don’t have many small chicks we put that on one, we don’t have many have many big chicks either so we put that under one we went all the way up to 4 and when we finished drawing it out we realised that both sides were symmetrical! We then drew a bell shaped curve over the graph to make sure it was an normal distribution. Then we split it in half to find the average or the mean of the chart which was 52.5 . we are proving are null hypothesis wrong, currently the white chicks are growing faster than the black chicks. That means that are hypothesis has almost been proved. We now just need to prove to p1-3 that are hypothesis is true.