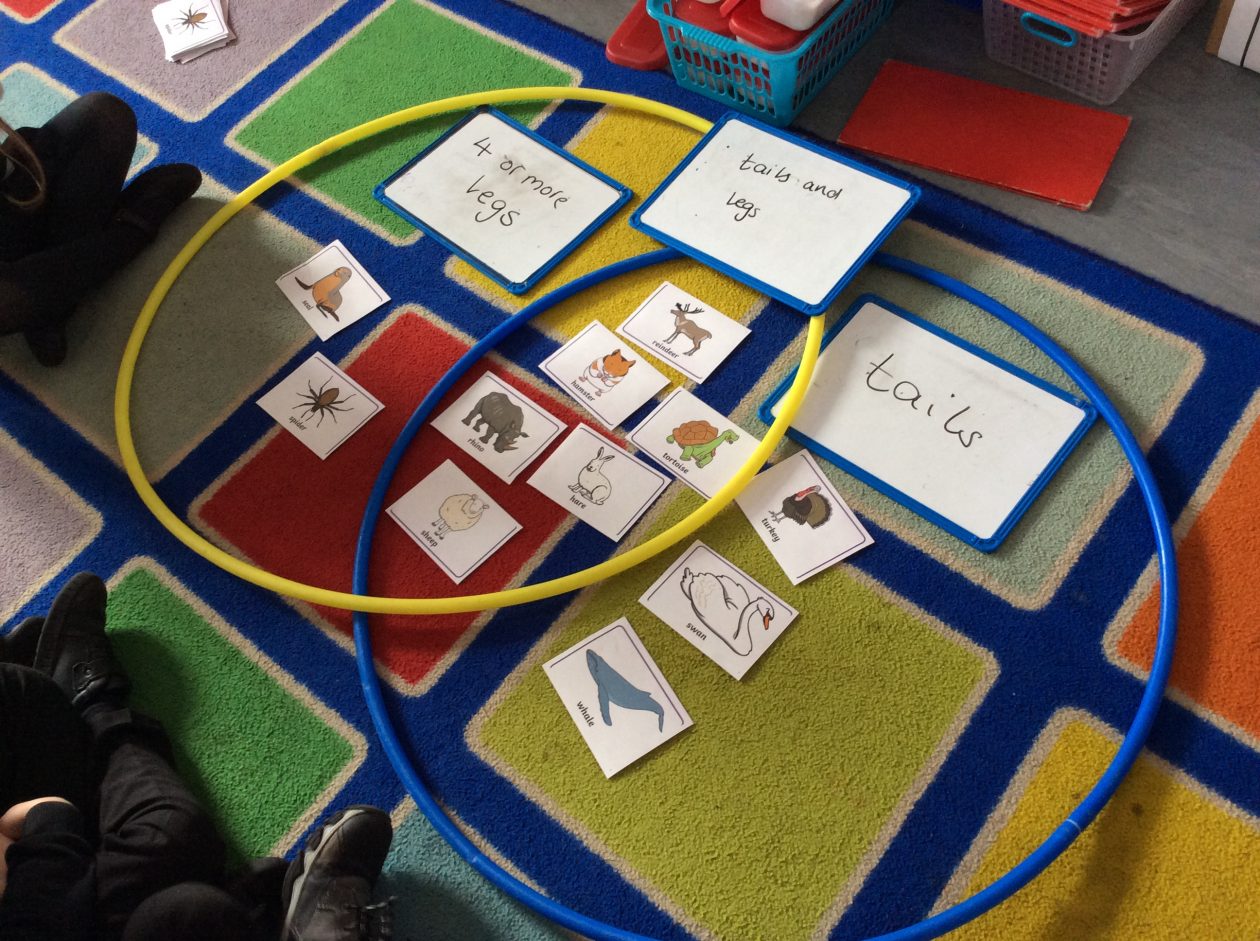
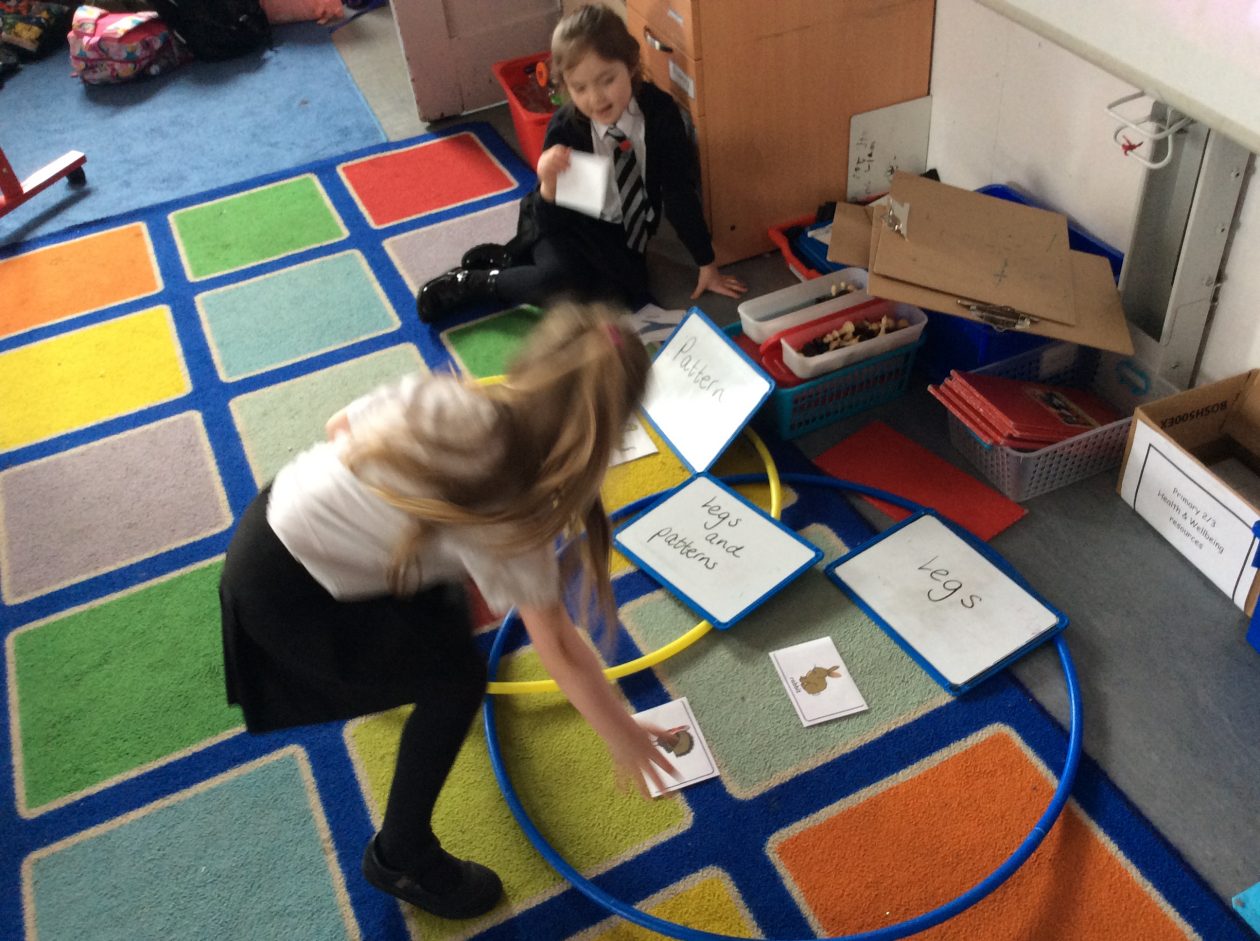
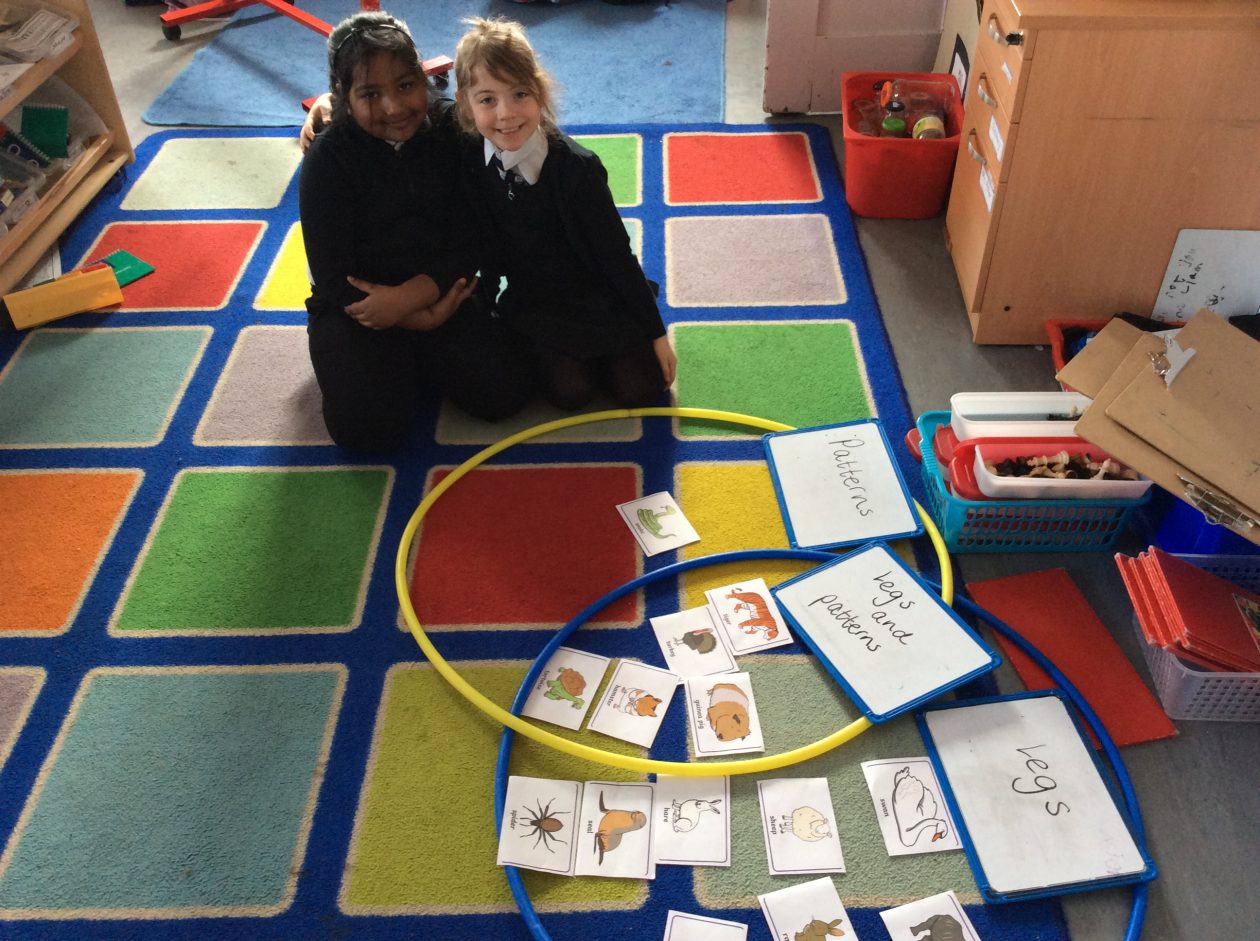
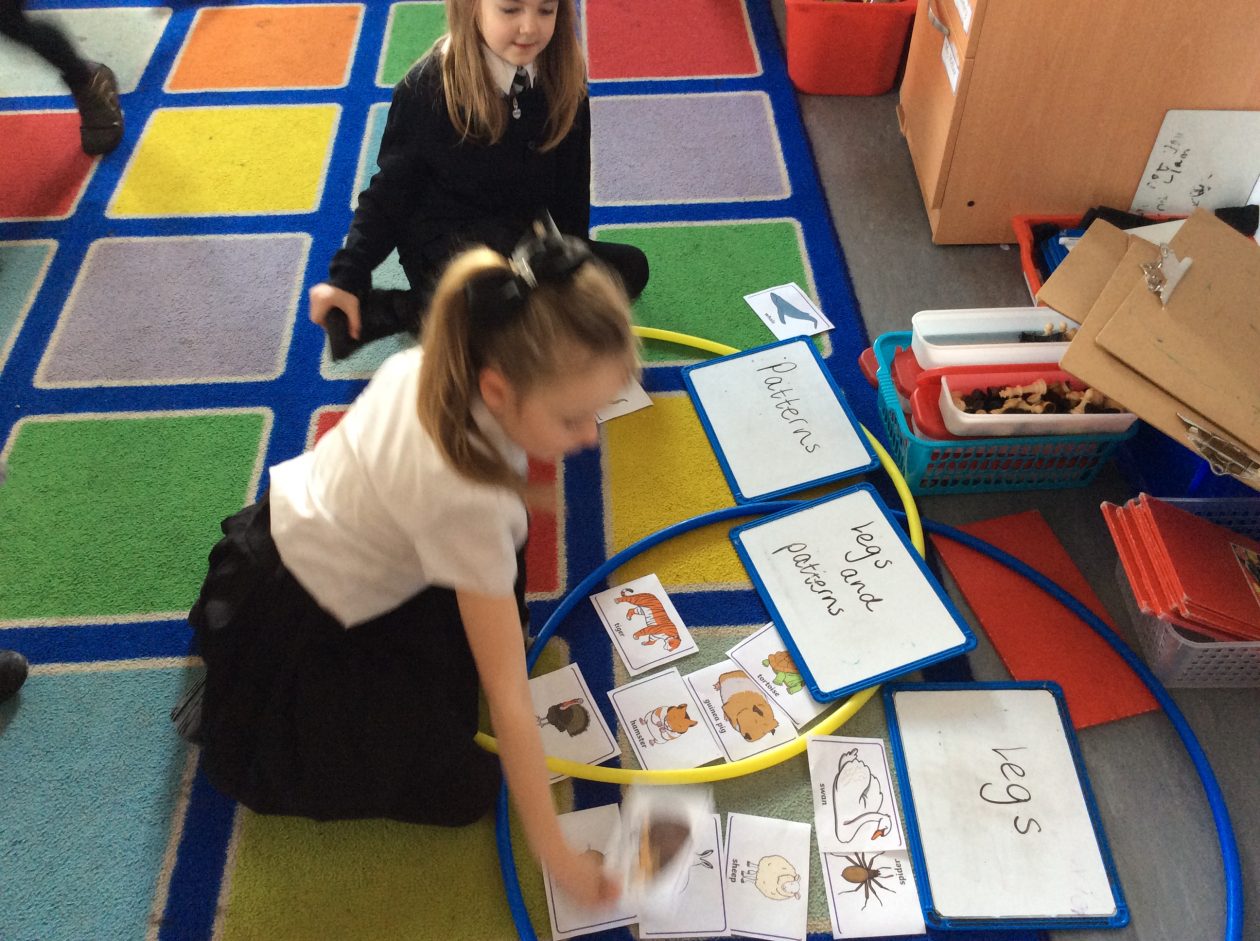
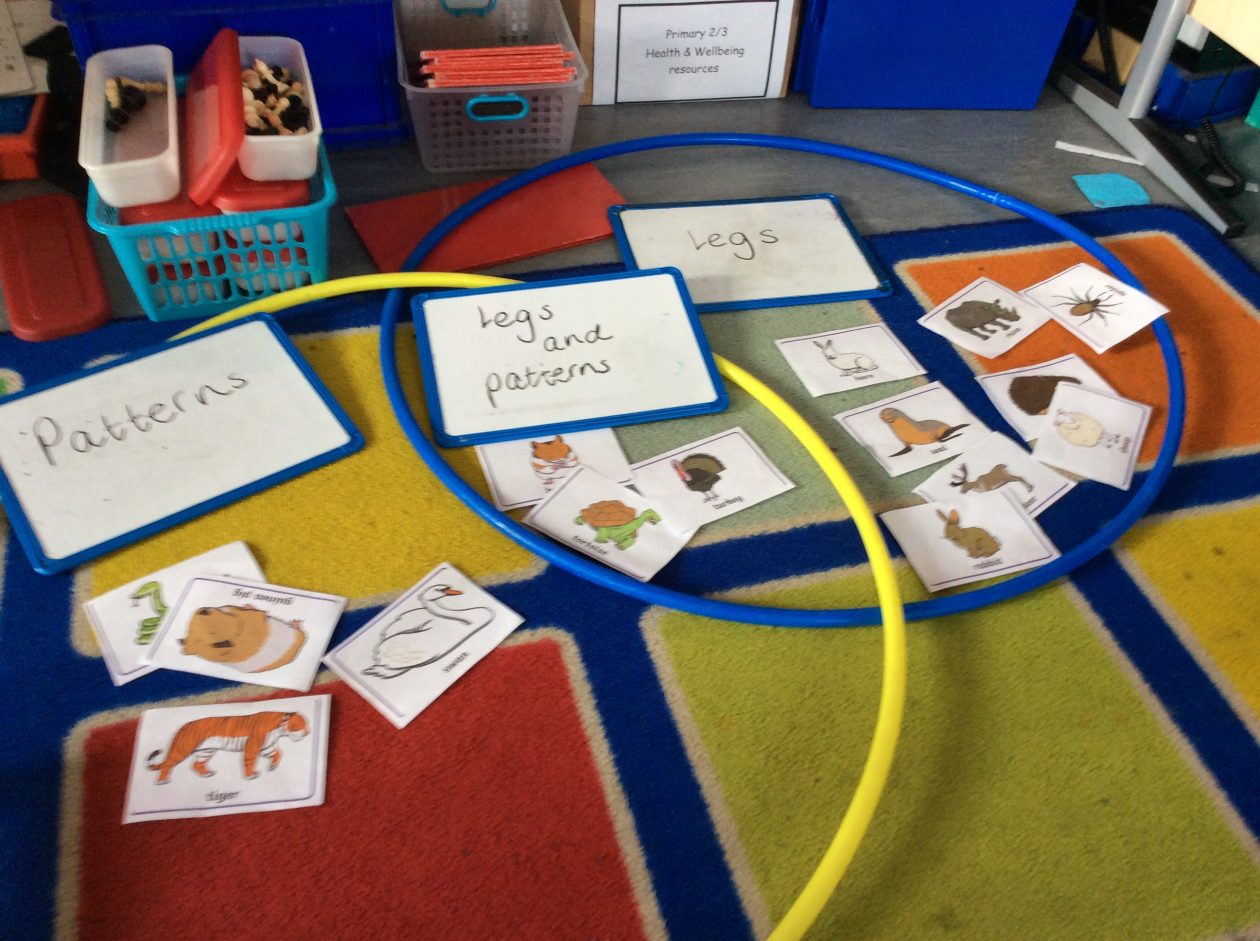
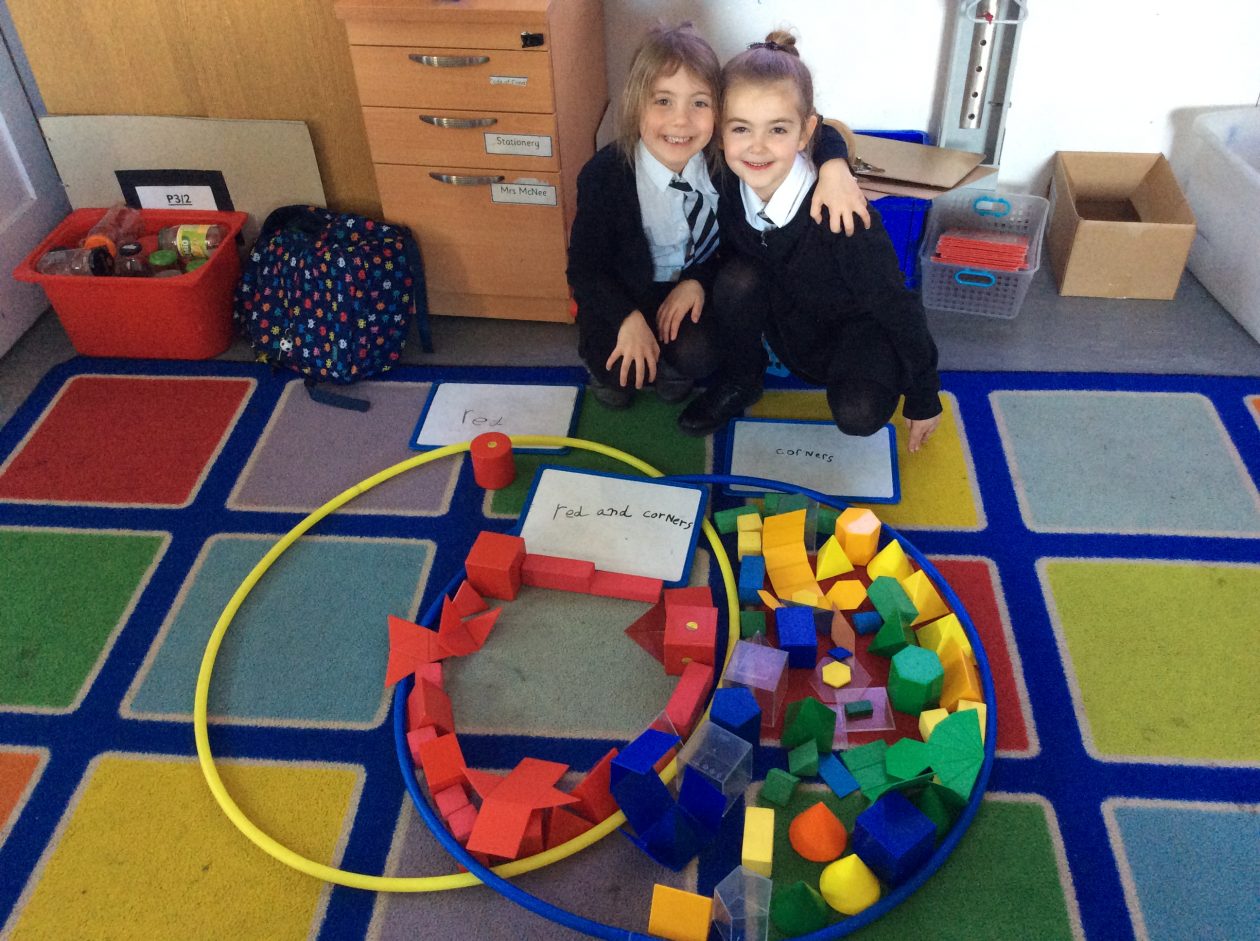
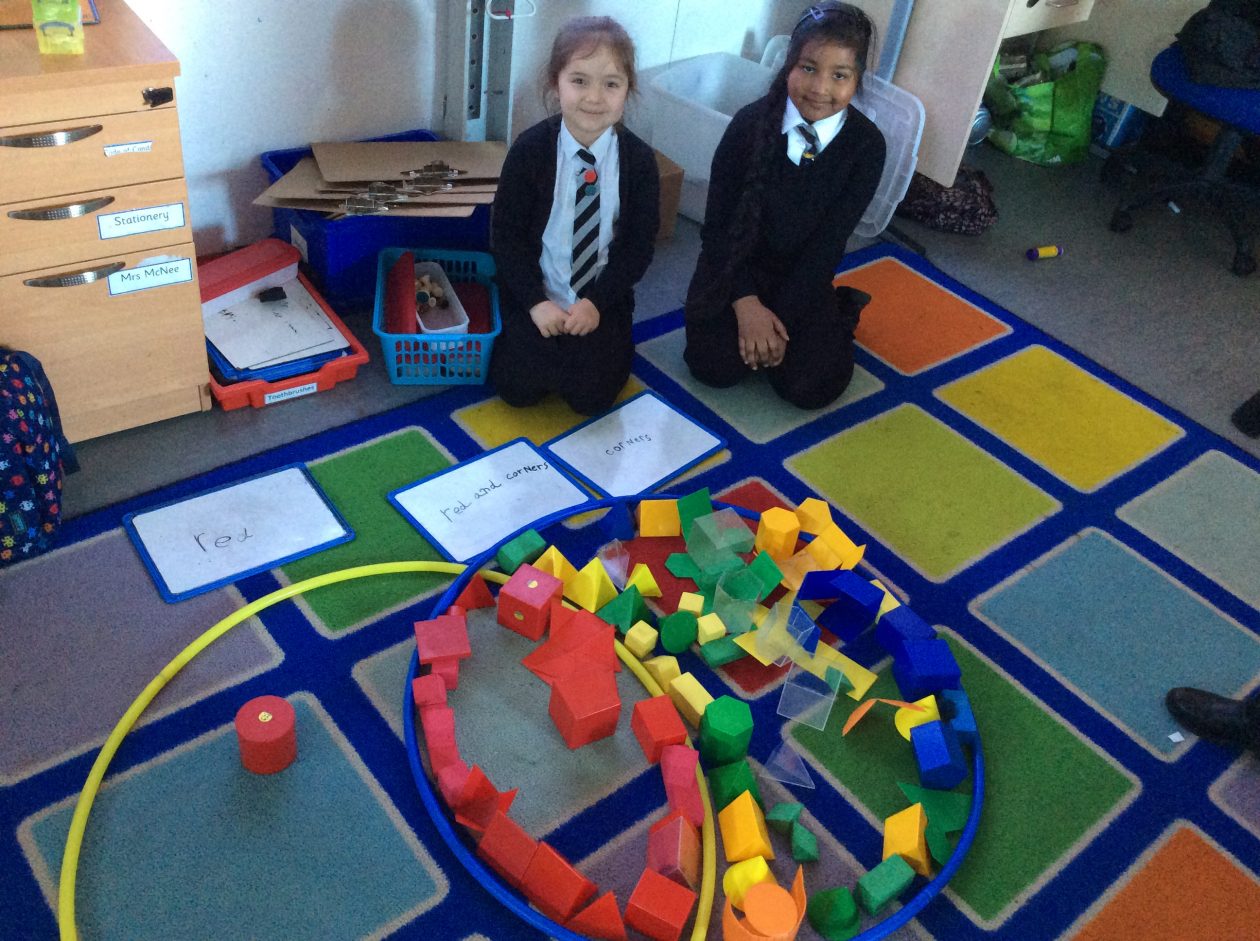
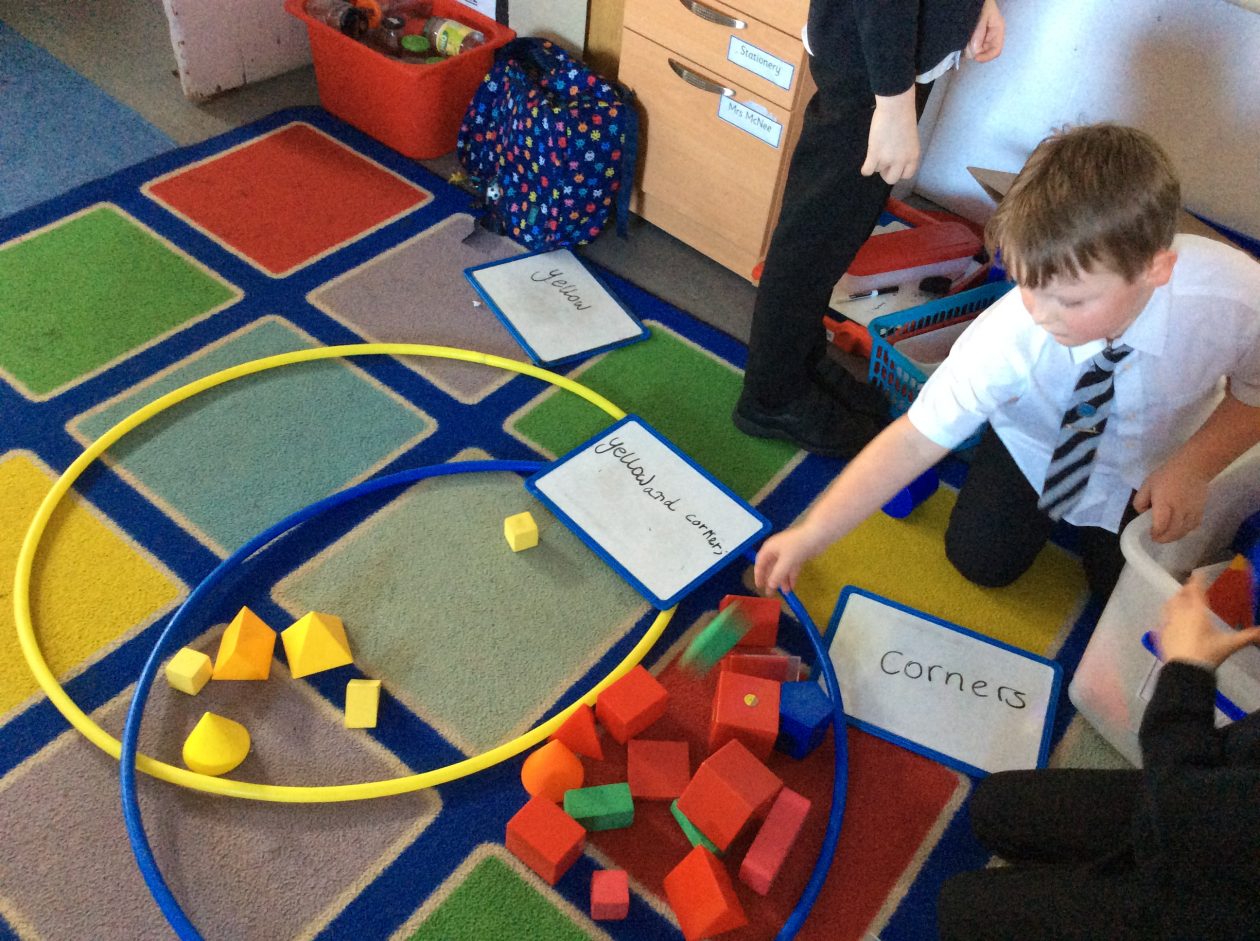
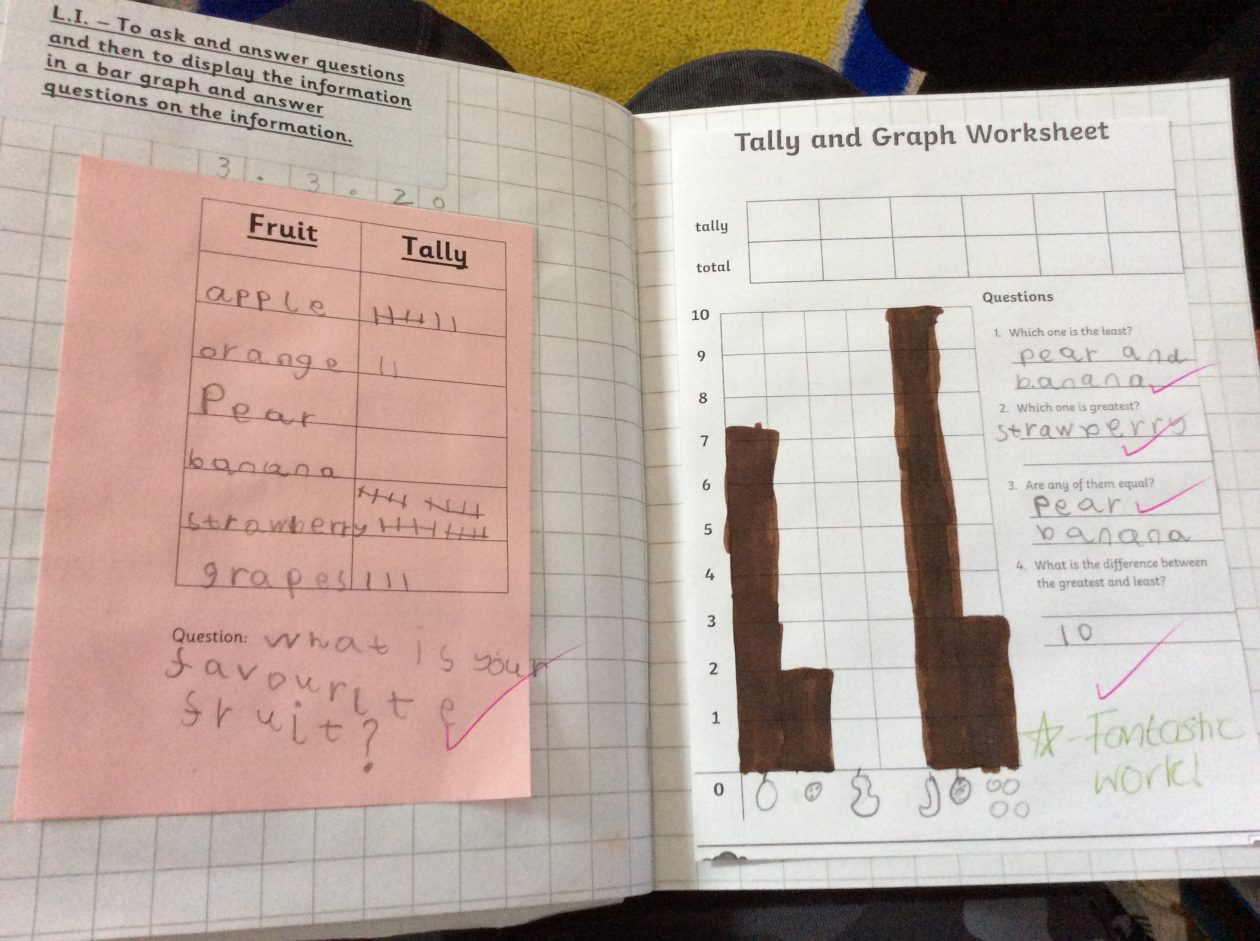
Over the last week the P2 boys and girls have been learning how to conduct surveys, how to record the information using tally marks, then use a range of different ways to display the information such as Venn diagrams and bar graphs.
Over the last week the P2 boys and girls have been learning how to conduct surveys, how to record the information using tally marks, then use a range of different ways to display the information such as Venn diagrams and bar graphs.

Glow Blogs uses cookies to enhance your experience on our service. By using this service or closing this message you consent to our use of those cookies. Please read our Cookie Policy.