Category Archives: Maths Elective

The End is Near…

At the beginning of this module, I tested myself for maths anxiety and the results suggested that I was ‘fearful’ about maths but that I didn’t have maths anxiety. As this is the end of the module, I have tested myself again and came out as ‘on the fence’, the level below the one I was a before. This is great, because it means that my feelings around mathematics have changed. It means that I am more positive and have become comfortable doing mathematics after having completed this module. Now though, I have to wonder what that means and why my feelings have changed.

The lecturer, Richard Holme, has been great. He is very enthusiastic and I thought that he was really good at keeping us interested and engaged. I also thought that he made us feel that we could ask questions and email with questions or queries to ensure that we really understood the content. This is something I am specifically going to take away from the module as I think that a lot of the feelings children will have about mathematics will come from the teacher. When teaching maths as a teacher, I would like to make the children feel that they can come to me and ask questions. I also would like for them to feel engaged and included in my lessons.

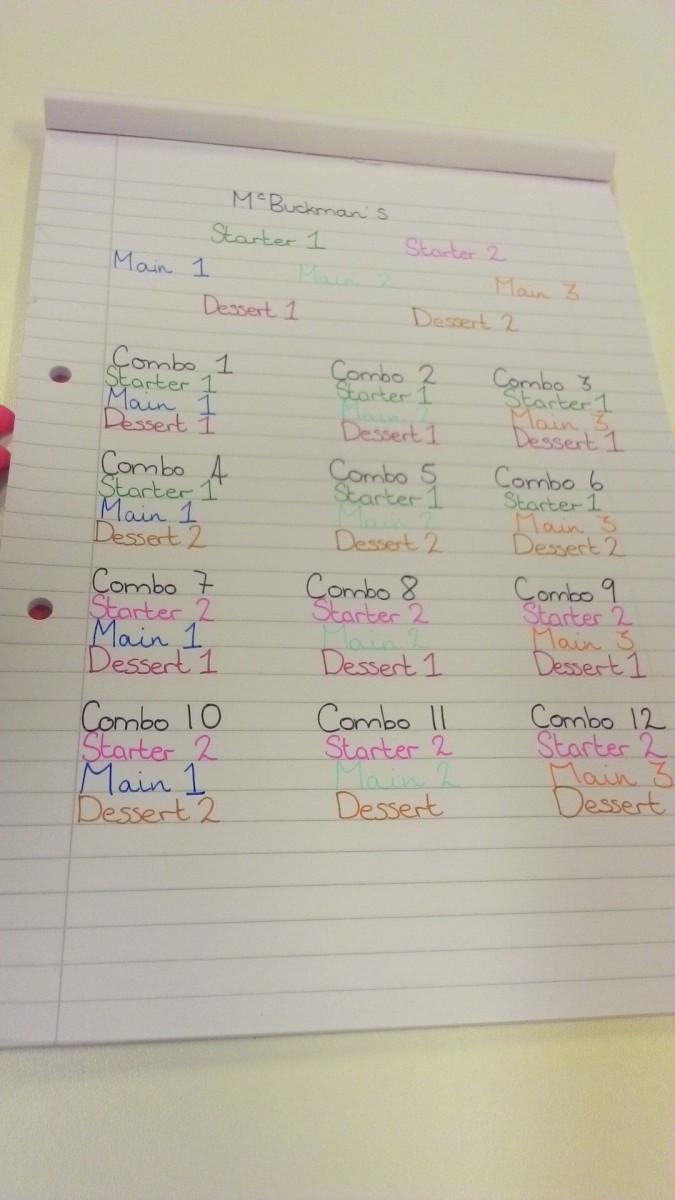
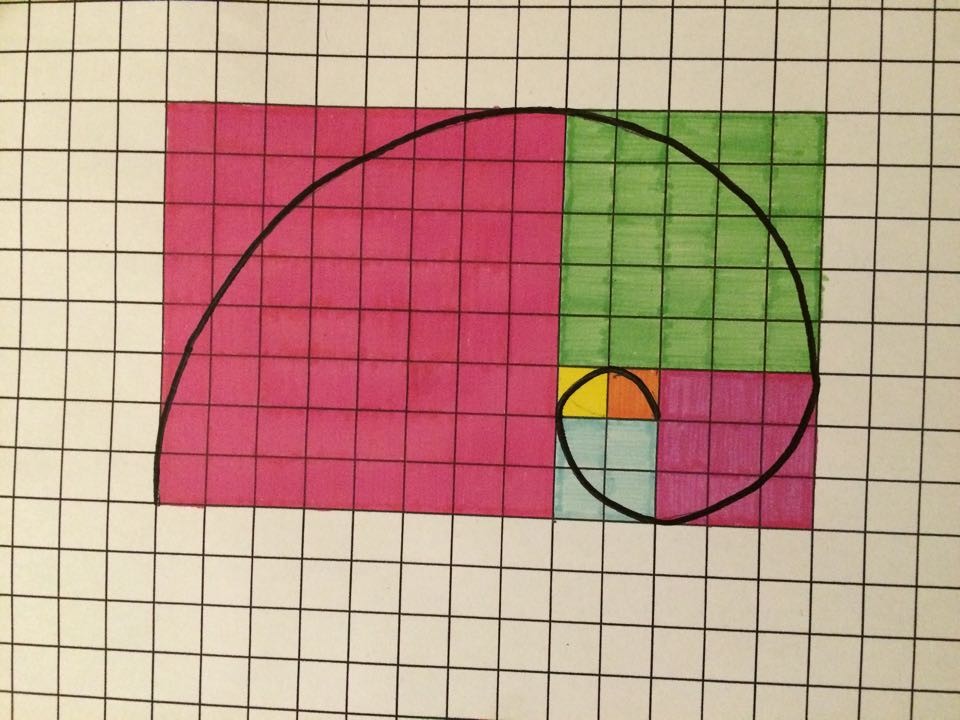
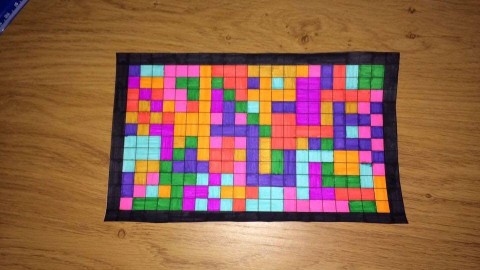
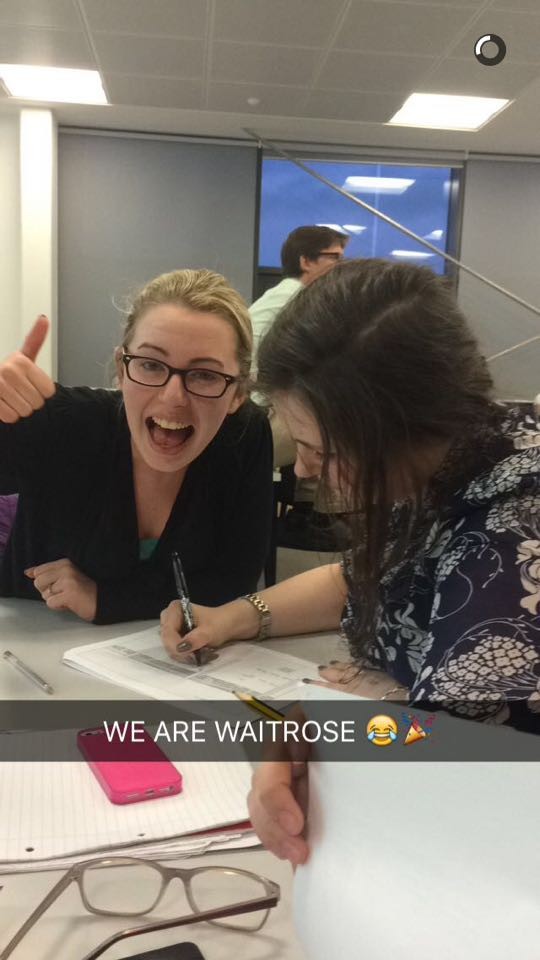
Additionally, I think that the content of the workshops we did were great because they were especially engaging. My most favourite was the ‘Demand Planning and Logistics’ workshop, especially the game we did to learn it. I thought it was a great activity to engage all of us and in response, I decided to us it as an example in my assignment. I think that other activities, such as the Fibonacci in art workshop or the using boardgames, were the same – active, engaging, and fun. I hope to do this for myself when I’m teaching.

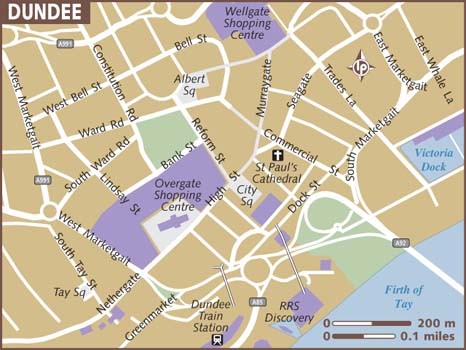
Of course, if I am being honest, I have not enjoyed absolutely everything in this module. I found my biggest weakness came in the ‘Maths in the Outdoors’ input. I knew I couldn’t read maps before the input, but to be honest I never really thought it was that important as I don’t like the outdoors and was almost certain that I was not about to take up hillwalking. That was before I took part in the workshop and when I realised that everyone around me seemed to know a lot more than I did, knew exactly how to complete the activities we were being asked to do. I hated that floundering feeling of just not being able to access these activities and I now realise that that is exactly how any children in my class will feel when activities are simply too obscure to them. This is something that I will always keep with me and try to use to help me be the best teacher I can be. I also realise that I need to look at my map reading skills, something my friend Kim has assured me that she will help me to do this very soon!

Chance and Probability


In this lecture on __/__/__ , we learned about probability and chance. We tried many activities in order to test probability and the chances of things happening. One such example of this was the ‘McBuckman’s’ task.

Screen Shot 2015-12-03 at 12.47.14

We were asked to work out how many meal combinations were possible using this menu. I struggled with this in the workshop, so I’ve had another go and came up with the following:

12334296_10207352156335810_2136903763_o

It took me a long time to put this together, and I had to get a bit of help, but I completely understand now. What is most striking to me is that there are clear patterns forming in the options. I worked out that each combination would only start with either ‘Starter1’ or ‘Starter 2’, and there were only three options for main (‘Main 1’, ‘Main 2′, or’Main 3’), so I then knew there were 6 possible starter and main combinations. Adding on dessert options meant multiplying the 6 options by 2 to get 12 combinations, and then it was simply a case of getting the fancy pens out!

So where does probability and chance come into it? I’ll admit that I had no idea! The best I can come up with is the probability of getting different things on the menu if left to chance. What I mean by this is:

There are 2 possible Starters, therefore there is a 1 in 2 chance of customers choosing each one;

The same goes for the dessert, there is a 1 in 2 chance of the customers choosing each one;

There are 3 potential main courses, so there is a 1 in 3 chance of each one being chosen by the customer.

I find that this makes a lot of sense and in a made-up example my simple probability calculations are accurate. Except, in real life there would be many more variables to consider, such as popularity of different items, so ‘Starter 1’ may be a lot more popular with people so more people pick it. For example, the most popular meal in McDonalds is the Big Mac meal, less popular seems to be the Fillet-O-Fish meal. This means that realistically, the probability of customers choosing the Big Mac meal is significantly higher than the Fillet-O-Fish meal. Clearly it is significantly more complicated than it seems and this links in nicely to a previous post about demand planning {https://blogs.glowscotland.org.uk/glowblogs/klduodeportfolio/2015/11/17/demand-planning-and-logistics/}


https://www.quora.com/What-are-McDonalds-ten-most-popular-products

Boardgames and Maths… Surely not?

  • Boardgames are fun,
  • There is maths in boardgames,
  • Therefore, Maths is fun

I’m not sure if that is quite right, but I do know that the second premise is true. Boardgames really do contain maths. On 1/12/15, we were all invited to bring in a boardgame and to play in the workshop, and I’ll admit that I was skeptical about it, but again, I was proven wrong. We  talked about where the maths comes into it, and I was not disappointed!


One such example was a jigsaw. We were tasked with finding as many uses for a jigsaw as we could, I could think of:

  1. Grouping
  2. Distribution
  3. Tessellation
  4. Randomisation
  5. Fractions

This makes a lot of sense as when most of us pick up a jigsaw, we tend to split the pieces up by colour, then we look for corners and straight edges and begin to build up the picture. The particular jigsaw we were using was a ‘Where’s Wally?’ one, so we considered distribution in the number people in the picture and then looked for the average number of people in a piece. Another obvious mathematical concept within comes in the form of tessellation, essentially that all the jigsaw pieces fit together to form a continued pattern, which is of course the case with a jigsaw.

Another game we had was Monopoly, the related mathematical concepts in Monopoly and I struggled to think of any. Yes, there is the obvious money, grouping of similarly priced properties, but I felt that there should be more, and they should be easier to find. When in doubt, take to google! I found this blog called ‘MONOPOLY MATH’ by someone called Lainie Johnson {http://blog.keycurriculum.com/monopoly-math/} which gave me loads of ideas, including:

  1. Shape (rectangles and squares on the board)
  2. Numerical orders (Properties are laid out in ascending value)
  3. Probability (Dice)

Or as Lainie sums it up, “addition, subtraction, multiplication, fractions, percentages, statistics, probability, interest, patterns, number lines, and basic geometry”

This, to me, is amazing, I love to think that there is still more to discover in the world of mathematics, things that are not abstract beyond my understanding. So from a teaching perspective boardgames are an untapped resource for children. In my experience, the only time we see boardgames in classrooms is during free time or on the last few days of term as a means of keeping children quiet. To me, boardgames could be used far more constructively, to improve maths skills in children. I also think that the activity we did in the workshop, where we had the game in front of us an had to find the maths could be a good co-operative learning activity for groups of children, with perhaps a reward near the end of the week to be able to play the game.

Fibonacci

If I am honest, I was not particularly interested in learning about the Fibonacci sequence, but I tried to be open minded. We learned that it is a number sequence in which each number is the sum of the sum of the previous two numbers:

eg. 0, 1, 1, 2, 3, 5, 8, 13, 21, 34, 55, 89, 144, 233, 377, 610, 987….

To me this was interesting,  as there is a very clear logic to the numbers, and it is almost aesthetically beautiful. My own choice of wording surprises me. I like that this


I also was told about Fibonacci coming out a lot in art, which was very interesting to me. when researching this, the most prominent was the Fibonacci spiral. This is a spiral which moves out from the centre by the Fibonacci numbers as demonstrated below:

12270538_1072624209457039_1626262591_n


After our lecture on maths in art, we were told that art containing fibonacci numbers is generally more aesthetically pleasing to us. I decided to try this out, as I  did not really see how this could be true. I tested it out for myself, I drew two pictures the same size, using the same colours. One used shapes which were based on fibonacci numbers, e.g. 3×5, or 1×8. The other used random numbers.

The Random Picture.

The Random Picture.

The Fibonacci-based Picture.

The Fibonacci-based Picture.

I then set about asking people I knew which of the two pictures they preferred. All of them said that they preferred the Fibonacci-based Picture. When asked why, none could give me a definitive answer. The best conclusion I can come up with is that the Fibonacci numbers in the picture are what makes people prefer the picture.

A Logistical Nightmare


Dundee

So far in the module,  the demand planning and logistics has been my favourite. I enjoyed the problem-solving nature of the activity and I think I was quite good at it.

Ever since, I have been looking for examples of this kind of activity in my everyday life. It is difficult to write about this one, as I am not  allowed to mention the company I work for nor the exact nature of my work, however I am going to try.

Essentially this weekend I had a 2-hour slot to go around 11 different pubs in the local area. This was a lot harder than you may think,  I had to plan my route around the city as I had to visit in three different post code areas. I admit that one thing I am really bad at is reading maps. I cannot ever seem to understand which way is North, what way round the map is, or where I am on the map. Usually I would just get someone else to do it, but this time I had to do planning for myself.

I decided to use Google Street-View to locate all of the places I needed to go and in what order. The time I had did not allow for doubling-back on myself, so I needed to get it right the first time. Initially I just put all the addresses in and thought it would do, but I found there was a lot of problems as I would have to drive up and down the same roads and it would not work in the time.

I found Google Street-View was a good tool for this kind of activity. I could put in all the addresses I wanted and then I could begin to switch them around until my route became as simplified as was possible and I could do all of the jobs in as short an amount of time as possible. I believe that this is logistics as I had information in the form of the addresses I had to get to and a problem in the form of how to get to them in a short period of time.

From a teaching perspective, this could be quite a good activity as it would teach children about planning routes themselves, especially if they too can’t read maps, it would also be a good problem solving activity, as it is fundamental mathematics but it does not require any maths skills in the academic sense, which could be a great activity to encourage confidence.

On a personal level, I have also learned that I should probably try to gain some confidence of my own in map-reading. This is something I am going tottery my best to do as  during the Outdoor Education workshop, I had to sit back and allow the others in my group to take the lead as I did not understand what was going on at all. I am going to make every effort to be able to do this.


http://www.lonelyplanet.com/maps/europe/scotland/dundee/


Demand Planning and Logistics

Demand Planning

Myself and Jenny found that we were quite good at this activity…

Demand Planning and Logistics

This activity was an interesting one for me. We paired up and had to complete the activity, based around demand planning. To explain what demand planing is, I found this video was really good at explaining it:

Basically it is planning ahead how much stock an organisation is going to sell so that there is enough stock available to sell so as to make as much profit as possible. Obviously that is a really simplified explanation, but that is what it is.

We got into pairs and were given a spreadsheet to fill in. We were given €5,000, and had to run a shop. We had to plan what would sell depending on the season and how much of it we should buy. Each season we were told how much of our products had sold and at what price and we then had to decide what to buy more of and what to stop buying.

The mathematics involved was not difficult, but it did require a lot of thought. Some people lost money by ordering the wrong products, such as Christmas selection boxes in the summer season, or ice-cream wafers in the winter season. We also had the option of buying ‘Premium Durian’, which only ever sold around 10-20%, and was therefore not a good buy as it would cost more to purchase than the profit made on them when sold. Also available were items such as beans, bananas and milk, which always sold at a minimum of 70%.

The maths was not the arithmetic involved, we had calculators and it was mostly very simple addition and subtraction. The real mathematics was in the patterns that began to form. It took some of us a a little while to understand this, but we had to be able to see that, for example, bread sales were always high, so investing in bread was a good idea as it always sold, whereas the durian did not sell or only sold very little. Of course it was important to look at the selling price of certain seasonal items in each season, as when it dropped suggested that it was not going to sell as well.

From a teaching perspective this was interest to consider, as on the face of it, it seems to be fairly complicated. However, the more I considered the activity, the more I thought it was one that I may try with children. I think that it could be done as a mathematics activity, but also a business one. It also occurred to e that this could be a really good activity to have children engage in cooperative learning and good to encourage them to take on group roles. I also think that it could be adapted and used in almost any class topic, maybe running a school or a zoo or maybe a park. I think that it would require a lot of build up and the children in the class would need to be given a lot of support. but it is definitely an activity I would try in the future.

https://www.youtube.com/watch?v=DuxpzqVX0xI

Productive Failure: A Recipe for Success!

Productive Failure, it sounds strange, basically it is a teaching strategy by which children are set up to fail. They are set a mathematics task that they have not learned yet: standard deviation; parabolas; algebra, and they have to try to do the problem by working through it. The method was first coined by Dr Manu Kapur, who is the head of the Learning Sciences Lab at the National Institute of Education of Singapore. His website – see above – is well worth a read of to see more of his work.

I have been thinking a lot about this method of teaching. Essentially children are being asked to complete problems that they do not know how to complete, it is completely beyond their abilities at this point. Initially I wondered how this could possibly be helpful, we all know the dangers of setting work at a level that is too difficult for the child to complete, with their self-esteem and confidence especially in a subject such as mathematics as it is the cause of much anxiety in and of itself.

But then I though more about it and it struck me that there were strong links with Productive Failure and Vygotski’s Zone of Proximal Development.

zpd-graphic

Essentially, Productive Failure asks children to work within the red section of the Zone of Proximal Development, as they are asked to complete problems that they cannot do. Now that I can see this, I realise that Productive Failure could be a highly useful classroom tool if used in the right way. I think that the method would have to be talked through first, so that children understand fully that it is not to catch them out, it’s not a test, and that it is a chance for them to see what they will be learning and look for possible links to topics they have done before. I also think that it would have to be a collaborative activity where children could work in small groups or pairs to work on a problem to bits of it work out. It would very much be about scaffolding and building up knowledge.

I think that this is a concept that I would like to use, possibly on my 3rd or 4th year placement to see if it works well in practice, and whether it is easily adapted to different ages and stages and even subjects, perhaps for beginning new topics or learning spelling words.


https://getyourheadaroundit.files.wordpress.com/2013/11/zpd-graphic.gif

http://qz.com/535443/the-best-way-to-understand-math-is-learning-how-to-fail-productively/

http://ideas.time.com/2012/04/25/why-floundering-is-good/

Maths Anxiety: What is it and how can we deal with it?

Maths Anxiety

Maths anxiety is about the way we feel when faced with everyday mathematical problems, for example adding up shopping; splitting the bill in a restaurant; or working out how much flour to put in a cake recipe. It’s not about ability in mathematics, one could be highly competent but struggle with the most basic mathematics. David Robson, writing for bbc Future is a good example of this, he says:

“I have a university degree … in mathematics. Yet somehow, advanced calculus in the privacy of my own room was a breeze compared to simple arithmetic under the gaze of others – or even remembering my building’s security code.”

You could not possible claim that he is ‘bad’ at maths, but he struggles with very basic mathematics, why? Maths anxiety was researched in Stanford University, where was shown that then people with maths anxiety are exposed to mathematics, their brains react in the same way as a person who had a phobia would react to seeing their phobia. We should take from this that maths anxiety is not about ability, it’s not a label for people who struggle academically. It goes deeper than that, just as you would not chase an arachnophobic person with a spider to cure them, you cannot throw mathematics in a high-pressure situation at a person with maths anxiety as it will not help.

Something that we should also be aware of is that girls may be more likely to occur in girls, especially if their teacher is also female. Even in my own experience, women are more likely to shy away from mathematics, however the Department of Empirical Educational Research, University of Konstanz found in a study that girls did have more maths anxiety than the boys, but that both had similar abilities when tested.

What can we do about maths anxiety? One suggested method is to have pupils with maths anxiety write about their fears, the idea being that they can see their feelings about it written down and not see them as insurmountable. It is also thought that pupils should be taught to approach mathematics in a completely different way. David Robson suggests looking at maths more as a challenge than a problem, to try to do it and not be put off because its maths.

As a teacher, we should remember that children will pick up on the way that we feel about maths. If we act as if we are nervous or scared by maths, then children will think that there is something to be scared of, which there is not. They also may not fully trust us to teach them properly and they may not get as much out of the lesson as they should. I think that teaching style may be important here, making sure to spot any pupils who may have maths anxiety and giving them the necessary support, allowing them to work through mathematics, without any need to be anxious.

I decided that I would find out for myself if I have maths anxiety, the test I used gave 10 questions and I had to rate how much I agreed on a scale of 1-5. The results suggested that I am ‘fearful’ about maths but not that I have maths anxiety. This is useful to be aware of, as I would hate to pass such fear on, and it is part of the reason I am taking this module. I think that

Goetz T, Bieg M, Lüdtke O, Pekrun R, Hall NC(2013) Do girls really experience more anxiety in mathematics?. Available at: http://www.ncbi.nlm.nih.gov/pubmed/23985576 (Accessed: 14 October 2015)

Robson, D (2015) Do you have ‘maths anxiety’?. Available at: http://www.bbc.com/future/story/20150619-do-you-have-maths-anxiety (Accessed: 14 October 2015)

Freedman, E (2006) Do You Have Math Anxiety? A Self Test. Available at: http://www.pearsoncustom.com/mdc_algebra/math_anxiety_material.pdf (Accessed: 14 October 2015)

www.theguardian.com/education/2012/apr/30/maths-anxiety-school-supportBrian, K (2012) Maths anxiety: the numbers are mounting. Available at: http://www.theguardian.com/education/2012/apr/30/maths-anxiety-school-support (Accessed: 14 October 2015)

The Ishango Bone – What does it mean to us?

Ishango Bone


After a lot of internet research, all searches for prehistoric maths seem to come back to the Ishango Bone. It was discovered in the Democratic Republic of the Congo in 1960 and is thought to be around 25,000 years old. At a first glance, it’s just a stick with some lines on it and they don’t make any sense.

Initially I thought it was perhaps a primitive tally chart. This would make sense, as the people who used it all those years ago may have needed to count, for example the resources they had or perhaps something like the birth rate. It would also be a very logical way of using numbers and is nothing  like our complicated numerical system, as it seems that | =1 and || = 2 and ||| = 3 and so on, compared to our system of numerical not actually depicting the number they represent like this.

Having looked into this more, it is clear that the prehistoric people were far more mathematically advanced than we give them credit for. The Ishango Bone has lines in groups, and the groups are split into 3 rows (a), (b) and (c). (a) shows a group of 9, 19, 21 and 11. (b) shows 19, 17,13 and 11. And (c) shows 7, 5, 10, 8, 4, 6 and 3. Row (a) and (b) both add up to 60, and it is thought that (c) uses multiplication by 2. This suggests that the prehistoric people who used the Ishango Bone must have had a fairly solid understanding of these numbers and been able to use them to aid their everyday life, much like we do.

Further research tells us that more recently the Ishango Bone has been shown to have more markings on it than first thought, and it shows links to the lunar calendar. Claudia Zaslavsky, an Ethnomathematician, wrote in 1991 “Now, who but a woman keeping track of her cycles would need a lunar calendar?”. She suggests that the Ishango Bone was used by a woman or women to keep track of their menstrual cycles. If this is true, then it could mean that the first mathematicians in the world were women, using mathematics to aid them in their everyday lives. This is significant, as even a Google search for ‘famous mathematicians came up with results such as Albert Einstein, Leonardo Pisano Bigollo, Pythagoras, Archimedes and John Napier. This is of course not to take away from all of their mathematical successes, but they are all male.

From a teaching perspective, this is highly informative. I think that it is highly important to take away from this research that when teaching is that generally we see boys going into traditionally male subjects such as mathematics and girls for traditionally female subjects, such as English. However this shows that women can be mathematicians and we, as teachers, should be encouraging this through providing positive role models for them. If the class I was working with was old enough to understand the menstruation part, I would share some of this information with the class to try to encourage girls in the class to do mathematics if it interests them and not be put off thinking that it is for boys. I will also try to remember that the numerical system and how it compared to the one we use and that children will need time to pick it up and therefore not to rush them. From a personal perspective, I am going to try to keep this in mind, but also I think that to remember that the prehistoric people were not as primitive as perhaps I believed before, and I will try to convey this in my teaching if it is ever possible.

Coolman, R (2015) The Ishango Bone: The World’s Oldest Period Tracker?. Available at: http://www.thedailybeast.com/articles/2015/10/06/the-ishango-bone-the-world-s-oldest-period-tracker.html (Accessed: 7 October 2015)

Mastin, L (2010) Prehistoric Mathematics. Available at: http://www.storyofmathematics.com/prehistoric.html (Accessed: 7 October 2015)

Weisstein, E (2015) Ishango Bone. Available at: http://mathworld.wolfram.com/IshangoBone.html (Accessed: 7 October 2015)

Williams, SW (2008) Mathematicians of the African Diaspora. Available at: http://www.math.buffalo.edu/mad/Ancient-Africa/ishango.html (Accessed: 7 October 2015)

Zaslavsky, T (no date) Claudia Zaslavsky. Available at: http://www.math.binghamton.edu/zaslav/cz.html (Accessed: 7 October 2015)

Tessellation

Following the lecture on 28/9/15 on creative mathematics, I had some idea of what tessellation meant, but had never considered it in any great detail. I decided to look it up and see what I could find out about it. I decided to investigate what shapes would and would not tessellate…

I started by choosing some random shapes to see if I could tessellate them myself. I chose an isosceles triangle (orange) [photo 1], a pentagon [photo 2], an equilateral triangle (purple) [photo 3], a hexagon [photo 4], a star [photo 5], and a right-angle triangle (pink) [photo 6]. I made copies of the shapes, cut them out and attempted to tessellate them. Now my cutting and sticking skills are not up to scratch, but think it’s still clear that some definitely tessellate while others do not.

Following what was said about the angles at the meeting points on the tessellation, I decided to check that this was true. I found that that I could measure that point and it did add up to 360°. The equilateral triangle [photo 8] and the hexagon [photo 9] had angles which were exactly the same, whereas the isosceles triangle [photo 7] and right angle triangle [photo 10] had two different angles which helped to add up to the full 360°

The star and the pentagon did not tesselate at all, so I decided to look into this a little more, and came up with this website. {https://plus.maths.org/content/five-fits}. It explains that we get convex and non-convex pentagons. Non-convex pentagons have points which are bent into the shape, see example [photo 11], and these are not included. In the example, it can be seen that the bottom ends in to the shape, which is why it is non-convex. They set out to find an irregular convex pentagon which would be able to tesselate. It appears that there are 15 pentagons which will tessellate, the most recent of which has been published this year by Casey Mann, Jennifer McLoud and David Von Derau at the University of Washington Bothell, which looks like this [I will make it clear at this point, that this is not my own work, simply a summary of research conducted by Marianne Freiberger and those she has cited]:

My conclusion from this research is that clearly mathematics is not as rigid as I previously believed. If this new ‘tessellateable’ pentagon was only discovered this year, then clearly mathematics is still  continually evolving and updating, meaning that mathematics really is all around us and there will always be new discoveries to be made. From a teaching perspective, I think that this is an important message to impart to children, that mathematics should not be done to them, but they should be doing it and trying things out and perhaps one day they will be discovering new shapes or theories, and they should be able to use the basic skills learned at school to do so.


Freiberger, M. (2015) A five that fits. Available at https://plus.maths.org/content/five-fits (Accessed 29 September 2015).

Math-Salamanders (2015) Shapes Clip Art Triangles & Quadrilaterals. Available at:http://www.math-salamanders.com/shapes-clip-art.html (Accessed 29 September 2015)

Wikimedia Commons (2006) File:Isosceles-right-triangle.jpg. Available at: https://commons.wikimedia.org/wiki/File:Isosceles-right-triangle.jpg (Accessed 29 September 2015)

<div>Icon made by <a href=”http://yanlu.de” title=”Yannick”>Yannick</a> from <a href=”http://www.flaticon.com” title=”Flaticon”>www.flaticon.com</a> is licensed under <a href=”http://creativecommons.org/licenses/by/3.0/” title=”Creative Commons BY 3.0″>CC BY 3.0</a></div>

<div>Icon made by <a href=”http://www.freepik.com” title=”Freepik”>Freepik</a> from <a href=”http://www.flaticon.com” title=”Flaticon”>www.flaticon.com</a> is licensed under <a href=”http://creativecommons.org/licenses/by/3.0/” title=”Creative Commons BY 3.0″>CC BY 3.0</a></div>

<div>Icon made by <a href=”http://www.icomoon.io” title=”Icomoon”>Icomoon</a> from <a href=”http://www.flaticon.com” title=”Flaticon”>www.flaticon.com</a> is licensed under <a href=”http://creativecommons.org/licenses/by/3.0/” title=”Creative Commons BY 3.0″>CC BY 3.0</a></div>