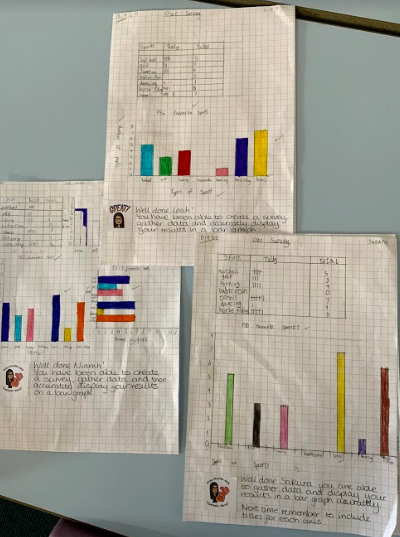
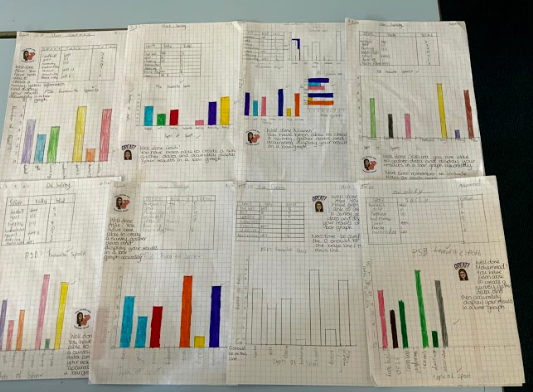
The Dividers maths group have been learning about using tables to record data and display results through a pictogram and bar graph. Due to the current restrictions, the group were not able to ask another class however, they had great fun using the phone on speaker to ask the other p5 class their survey question.
The next step will be for the pupils to use a spreadsheet to produce a graph.