
 |
||
| In your jotter write the DATE in the margin. Now add a TITLE for your homework. Your title should be the name of the Homework: Heat Homework Wk 1 |
| Question 1 | |
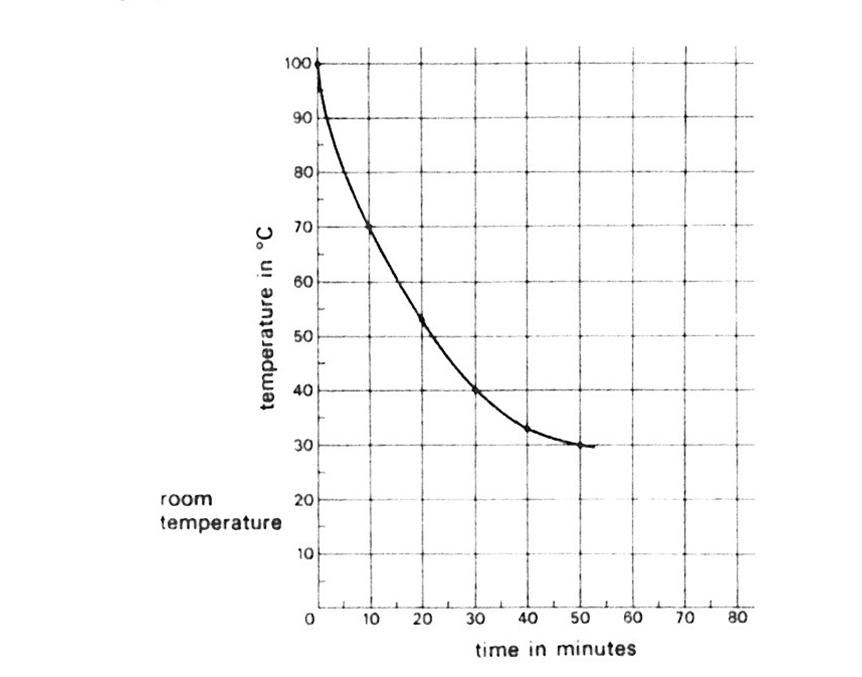
| A scientist is testing an electric kettle to see how fast heat escapes in a room at 19C. He places a thermometer down the spout and boils the water. He switches off, and starts his clock at the same time. He records the temperature of the water every 10 minutes. Here are his results on a graph. | |
 |
|
| a) | Which of the ranges of times shows the biggest drop in temperature? |
| A | 0 and 10 minutes |
| B | 10 and 20 minutes |
| C | 20 and 30 minutes |
| D | 30 and 40 minutes |
| b) | By what time had the temperature of the water dropped by 50%? |
| c) | What was the drop in temperature in the first 50 minutes? |
| d) | Express the drop in temperature after 30 minutes as a percentage fall. |
| Question 2. | |
A bar of chocolate contains 540 kilojoules of energy. There are 9 squares in the bar.  |
|
| a) | How many kilojoules of energy are in one square of chocolate? |
| b) | |
| Mina’s daily energy requirements are estimated at 8,400kJ. How many chocolate bars would Mina need to eat to provide all of her energy needs? | |
| c) | |
| A rival chocolate company wanted to produce a low energy chocolate to appeal to dieting choco-holics. They wanted to produce a bar with only 70% the energy of he original bar. How much energy (in kJ) would that bar contain? | |
| Question 3. | |
| The table shows the energy used to heat a building during the months July to November. It also shows the average outdoor temperature during these months. | |
 |
|
| a) | Use the information in the table to produce a bar chart of energy use over the five months shown. |
| b) | What was the total energy used in the months when the average outdoor temperature was less than 15 ºC? |
| c) | From the data it can be concluded that… |
| A | As the average outdoor temperature falls, the energy used stays the same |
| B | As the average outdoor temperature falls, the energy used increases |
| C | As the average outdoor temperature falls, the energy used decreases |
| D | The data does not allow a conclusion to be reached |
| Question 4. | |
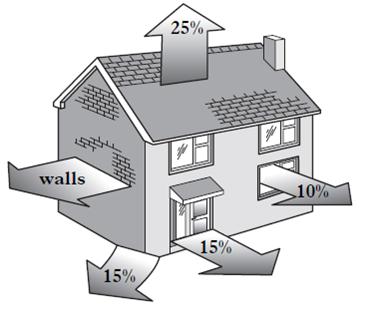
| Heat energy is lost from five parts of a house as shown in the diagram below. | |
 |
|
| a) | What percentage of energy is lost through the walls? |
| b) | Present the information from the diagram in a table with suitable headings. Your table should include the value you calculated for the percentage heat loss through the walls. (answer to question a) |
| Question 5. | |
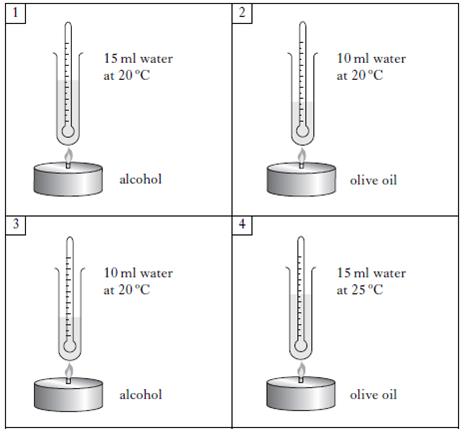
| Craig investigated how quickly water could be boiled using liquid fuels. | |
 |
|
| Which two boxes should he choose for a fair test? | |
| A | 1 and 2 |
| B | 2 and 3 |
| C | 1 and 3 |
| D | 2 and 4 |