LI: We are learning how to display information on a bar graph.
SC: I can identify the title, x axis, y axis and labels on a bar graph.
LI: We are learning a how to interpret information on a bar graph.
SC: I can analyse information on a bar graph using the y axis to help me.
Through the context of our Toys topic, Primary 1b have been learning about different ways to collect, sort and display information.
We have:
– Carried out surveys, recording our results with tally marks;
– Sorted our toys and other information on Venn Diagrams using our own and given criteria; and
– Displayed information about our favourite toys on a block graph.
On Friday, we learned about bar graphs. We created a copy of the block graph which we made on Monday, to allow us to transform it into a bar graph. First we drew around the outline of each tower of blocks, and imagined that we were melting blocks of chocolate into long bars of chocolate.
Then we realised that we could no longer count how many people voted for each toy. After some brainstorming, Oscar suggested that we needed to put numbers on our graph. That’s when we learned about the purpose of the y axis.
We used our bar graph to answer interpretation questions. Amorie analysed the bar graph and told everyone that dolls were the most popular toy, and Isla MacKinnon told everyone that construction toys were the least popular.
Finally we applied what we had learned in order to interpret a variety of other bar graphs online.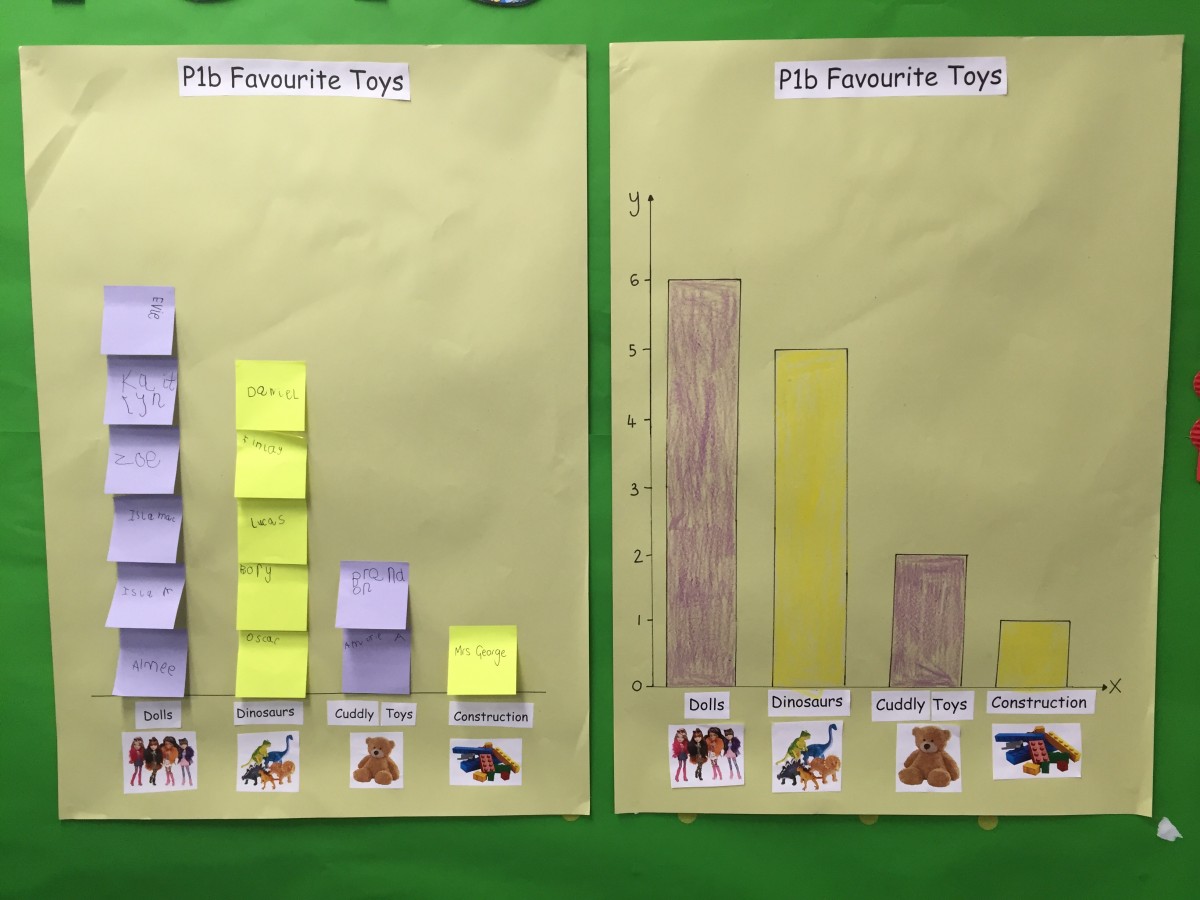

I am impressed that you know about the features of a graph and in particular the purpose of the axis on a graph.
What was the difference between the most favourite toy and the least favourite toy?
Which toy did most girls prefer?
Which toy did least boys prefer?