Category Archives: Discovering Maths

Maths and squash

The discovering mathematics module has made me curious about things in everyday life that involve maths. Squash is a fast game which requires a good level of physical fitness and agility but also a great deal of maths is involved in playing the game.

In a game of squash you can only win a rally on your own serve and the serve only passes from one player to another when the serving player loses a rally. The winner is usually the player first to reach 9 points. However if it is 8 all the game can be played to 9 or 10. The person who is receiving or in other words lost the point decides this. So what should you decide? This is where maths comes into the game?

The answer all comes down to probability which of course is a fundamental mathematics principle.

According to Beardon (2001)

‘Assume players are called A and B. Assume that the probability of A winning a rally is p, whether he serves or not, and whatever the score is. The probability for B is q, where p+q=1

There are four outcomes to be considered and need to find the four probabilities:
Pr(A wins the next point given that A serves first)  =θ,
Pr(A wins the next point given that B serves first)  =φ,
Pr(B wins the next point given that A serves first)  =λ,
Pr(B wins the next point given that B serves first)  =μ.
Let us find θ. One possibility is that A wins the first rally, and  the first point; he does this with probability p. If not, loses with probability q and B then serves.
For A to win the next point he must win the next rally (with probability p) and then the situation returns to that in which A serves and wins the next point with probability θ. Therefore  θ=p+qpθ, and hence Pr(A wins the next point given that A serves first)=θ=p1pq.
Next, we find φ. As B serves first, A must win the next rally (with probability p). The position now is that A is serving and must win the next point (which he does with probability θ). Thus φ=pθ, and hence Pr(A wins the next point given that B serves first)=φ=p21pq.
By interchanging A with B, and p with q, we see that Pr(B wins the next point given that A serves first)=λ=q21pqandPr(B wins the next point given that B serves first)=μ=q1pq.
Note that

Pr(A or B wins the next point given that B serves first)=φ+μ,

and

φ+μ=p21pq+q1pq=p(1q)+q1pq=p+qpq1pq=1pq1pq=1.
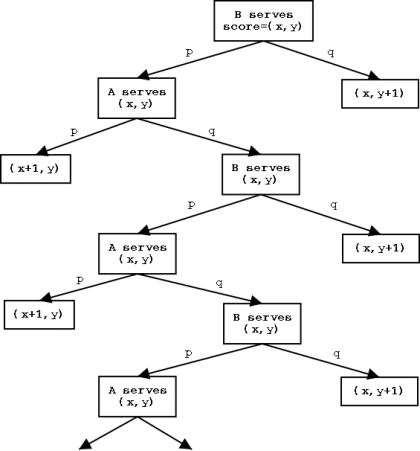
It follows that if B serves first, then the probability that A or B eventually wins a point is one; hence the probability that the game goes on for ever is zero! You may like to draw a tree diagram to illustrate this, and you will find that a succession of rallies in which nobody scores a
point is represented by a long ‘zig-zag’ in your tree diagram. The start of the tree diagram is
.

The rules of squash say that if the position is reached when the score is (8,8) (we give A’s score first), and B is to serve, then A must choose between the game ending when the first player reaches 9 or when the first player reaches 10. We want to decide what is the best choice for A to make (when p and q are known).

If A chooses 9, then he wins the game with probability φ. Suppose now that A chooses 10; then the sequence of possible scores and their associated probabilities are as follows:

Sequence of scores Probability Probability in terms of p,q
(8,8)(9,8)(10,8) φ×θ p3/(1pq)2
(8,8)(8,9)(9,9)(10,9) μ×φ×θ p3q/(1pq)3
(8,8)(9,8)(9,9)(10,9) φ×λ×φ p4q2/(1pq)3
It follows that the choice of 9 by A is best for A if φ>φθ+μφθ+φ2λ, or, equivalently, 1>θ+μθ+φλ. In terms of p and q this inequality is
1>p1pq+pq(1pq)2+p2q2(1pq)2and this is equivalent to (1pq)2>p(1pq)+pq+p2q2.

After simplification ( p+q=1), this is equivalent to p23p+1>0.

This means that A should choose 9 if p<0.38 and should choose 10 if p>0.38.’
References
https://nrich.maths.org/1390

Maths in health care

Recently we had a lecture from Dr Hothersall a Consultant in Public Health with NHS Tayside. This a lecture I found really interesting because I was able to clearly relate to where maths is used for genuine purposes.

When a relative is in hospital you have faith that they are being cared for by doctors and nurses but until Dr Hothersall’s lecture I never thought about the application of maths in the health profession. One important role of maths in health care that Dr Hothersall discussed was the calculation of drug does. Some basic maths principles used to calculate drug does are conversion, mass, volume, calculation.

I decided to look further into the application of maths in health care following this lecture.

According to ‘Skills for life a practical guide for social care employers.’ Skills for Care
(2009, p.7)

‘The impact of poorly developed numeracy skills at work could mean that employees:

are unable to estimate quantities, costs and timings;
cannot make quick mental calculations and lack the confidence to do routine calculations, even with the use of a calculator;
don’t always take accurate measurements or readings and are unable to spot errors;
make mistakes when recording numerical data and have difficulty interpreting information displayed in the form of graphs or charts;
have difficulty reading the time or understanding timetables, leading to poor time management

All of the above will have implications for the care of a patient which highlights just how vital the role of maths has in a nurses job.

Something that really interested me was that taking an x-ray involves the application of maths

Radiographers need to use maths to determine the correct exposure time to to create the x-ray image. Factors which need to be considered are:

Size of the patient
Thickness of of the area being X-rayed
Disease which may affect the image.
Power of the machine being used.

The radiographer measures the section to be X-rayed and set controls on the machine to produce radiographs of the appropriate density, detail and contrast.

The standard formula is that the total amount of X-rays must increase by a factor of two for every five centimeters of body thickness to maintain the right contrast.

Although too little exposure will result in an image not bright enough for diagnosis, too much exposure is potentially dangerous for the patient.

Therefore X-rays rely on the radiographer being skilled in maths to be able to calculate precisely the right amount and length of exposure.

References

http://www.achieve.org/files/MathAtWork-Health.pdf

http://shop.niace.org.uk/media/catalog/product/m/a/maths-in-the-workplace.pdf

www.achieve.org/files/MathAtWork-Health.pdf

Predicting the weather

A  recent workshop on maths and science got me thinking about the weather forecast and how mathematics must be used in order to correctly predict the weather.

METEOROLOGY is the science that deals with the phenomena of the atmosphere, especially weather and weather conditions.

According to the met office calculations of subtle changes in the basic variables  are carried out. These include: wind speed and direction, temperature, pressure, density and humidity  this is recorded at millions of data points in our atmosphere. Seven basic equations at each data point are created which amounts to solving tens of millions of equations. Amazingly this is done in minutes because of computers capable of over one thousand billion calculations per second (a measure called petaflop), and databases hold information in multiple petabytes.

According to the Met Office ‘by combining equations describing heat and moisture with equations governing the wind and pressure, we can form a new variable called potential vorticity, or ‘PV’. Vorticity is a measure of swirling motion. PV actually helps us to identify key mechanisms that are responsible for the development, the intensity, and the motion of weather systems – including superstorms such as Hurricane Sandy – because it encapsulates over-arching physical principles that control the otherwise complicated ’cause and effect’ relationships. These principles enable us to decide what is predictable amid the detailed interactions.’

Techniques for making a forecast is to use weather maps to estimate . Things that might be estimated are: the speed of movement of air masses, fronts, and high and low pressure systems and all these things are plotted onto graphs and charts.

The ability to read temperatures and pressures is key to organising weather material.

Thermometer:   Is an instrument for measuring temperature, especially one having a graduated glass tube with a bulb containing a liquid, typically mercury or coloured alcohol, that expands and rises in the tube as the temperature increases. There will be a scale on this in positive numbers and negative numbers to represent the temperature.

Hydrometer:   Is an instrument  used for measuring the velocity or discharge of water, as in rivers, from reservoirs,from clouds to earth, etc., and called by various specific names.

So as we can se there are many mathematical concepts evident when forecasting the weather which include:

Equations
Geometry
Estimating,
Charts
Graphs
Scales


References 

http://www.metoffice.gov.uk/barometer/in-brief/2013-07/the-role-of-maths-in-weather-and-climate-prediction


Science and maths

It has become increasingly apparent over the past few weeks that science has many links to maths. We have recently had a  workshops with Neil Taylor.

First we were asked to come up with as many reasons as possible about why maths is important to science. our group did quite well, coming up with; measurement, data, statistics, temperature and scales.

We then plotted the following graphs:
y=x
y=x^2
y=1/x
y=1/x^2

The most enjoyable part of the workshop was measuring magnetic force against distance with magnets. We had our experiment set up like the picture below. The magnets were set 15 cm apart and the scales were set to zero. We used the ruler to reduce the gap 1cm at a time until the gap was 2cm. At each cm reduction we recorded the force. We plotted a graph using the data of the force against distance and found that looked most like the graph y=1/x^2.


Picture1


This is an experiment that can be easily carried out by the children in the classroom which I think they would thoroughly enjoy. The children will be able to make clear links between the links that science has to maths by doing this. The children will have to use key maths concepts such as:

  • Collecting data
  • Choosing how to present data
  • Drawing charts and graphs

By the end of the workshop the use of maths was much more evident.

In science everything is measured, time, speed, volume, capacity, density and these are only a few.

Science is the study of how the universe – and the things that exist in this universe – work. The language that is used in science is maths.

Math can help us understand what scientists discover and helps find relationships between an experiment’s hypothesis and the data that is collected.

By using statistics, scientists can use data as evidence to support or disagree with their theories. Without the use math it would be impossible to prove these theories.

Maths is used to accurately determine calculations or scientific principles.


References

http://www.kumon.com/resources/how-science-and-math-are-related/


creative maths

Until recently I would never have believed that maths and art are linked, however after a workshop in discovering maths I now know this to be true.

The Fibonacci sequence is a series of famous numbers 1,1,2,3,5,8,13,21,34… But what is it that is important about these numbers and how can they be used in art work?

In 1509, Italian mathematician Luca Pacioli published Divina Proportione, a treatise on a number that is now widely known as the “Golden Ratio.”

In an equation form, it looks like this:

a/b = (a+b)/a = 1.6180339887498948420 …

This ratio, symbolised by Phi (Φ) appears a lot in nature and mathematics.

Here are a few examples of the golden ratio being used in nature and in architecture

download images (1) images (2). images

After the workshop I started looking at things in my house and thinking about how aesthetically pleasing they look, was the golden ratio used to create these?

One thing that struck me was a set of Davinci paintings on the wall that I have always thought looked quite strange, I began to wonder if the body was drawn in proportion to the golden ratio?

download (1)


This drawing is based on the correlations of ideal human proportions, however after research it is concluded that the drawing does not follow the golden ratio.

Vitruvian_vs_Golden

Demand planning

If you’re like me you will walk into the shops in October and get frustrated at the christmas gifts starting to be put on the shelves. However during a recent workshop I got an insight into demand planning and what this means for supermarkets or shops and how fundamental maths is incorporated.

So what exactly is demand planning? Click here to find out.

After watching this short clip we got the opportunity to experience demand planning for ourselves. We were told we had £5000 to spend to start with and there was some rules for playing the game:

  • Decide how you will spend your money. Complete the order form and submit your order.
  • You can only order a maximum of 5 unique SKUs per sales period (quarter year), you can order less than 5 SKUs.
  • Keep a track of what you have ordered. Complete your stock list. Include any cash at bank at end.
  • When your sales figures come in calculate value of sales (unit selling price x quantity sold) per item SKU.
  • Keep track of any stock left each period (unless it is a ‘write off’). Calculate the value of this based on purchase value. Calculate your balance sheet business net worth (hope fully increasing each period!).
  • Now place orders for next period (quarter year).

Me and my partner decided we would spend our whole £5000 to start with and decided on practical food that people would buy every day such a bread, milk and bananas however we also took a risk and ordered 60 units of champagne and 1500 units of beer as we noticed that these had quite a high mark up values. Our strategy paid off as we sold between 80 and 90% of our every day items and between 50 and 60% of our champagne and beer giving ourselves a nice profit of £6290.

The following months July – September, we decided that the best products to buy would be things like soft drinks and ice cream wafers as it was the summer months. We also had units of beer and champagne left over to sell. Again we decided to spend all of our money in the hope that the more money we spent the more profit we would make. Again this worked giving us a massive £18,295 profit.

As the game continued we used the same tactics of ordering products based on the month, e.g frozen turkeys on the lead up to christmas and spending as most of our profit each time. By the end of the game we had turned our £5000 into a whopping £69,222.

We had lots of fun playing the game but it got me thinking about this being someones job. For somebody to successfully do this job and make the organisation/ supermarket chain etc profit fundamental maths principles must be used. Things to think about are products that will sell at certain times of the year, how much of a certain product will be sold and what products will be wasted if not sold and what can be kept.

Some maths principles involved are:

Looking at statistics and data from the previous year to calculate how much of a products will potentially be sold.
Analytical skills
Problem solving
Noticing pattern forming in sales
Calculations

Food miles

Have you ever wandered around Tesco and wondered the mathematic principles behind how all this yummy food got there? No me neither, usually I’m thinking about what delights I am going to have for dinner.

However, a recent discovering mathematics workshop got us thinking about the fundamental maths behind the global food chain.

I have often seen campaigns for food being sourced locally and local shops pushing for produce to be bought from them because it is better value for money or better for local business. So the question is, is it better to buy food sourced locally or from elsewhere around the globe? There are two things to be considered when answering this question, 1. climate change and 2. money.

As discussed in Richard’s workshop a study into local lamb and New Zealand lamb was carried out in 2006 by Saunders, the findings were:

Comparison of energy used and CO2 emissions between NZ and UK Lamb.

The energy used in producing lamb in the UK is four times higher than the energy used by NZ lamb producers, even after including the energy used in transporting NZ lamb to the UK. Thus, NZ CO2 emissions are also considerably lower than those in the UK.

As we can see from the study CO2 emissions are lower in producing lamb in New Zealand than the lamb produced in the UK and the energy used is higher in the UK than New Zealand. However that is not the only factor to be considered, of course another question when asking if food is better sourced locally or from around the globe is how cost effective is it?

This is where the fundamental maths comes into play. To save on energy and create less CO2 emissions the lamb will have to be transported from New Zealand to the UK. Some mathematical principles to be considered when transporting the produce:

  • Mass (weight) – How much meat can actually be transported. There are weight restrictions for lorries, trucks and aircraft.
  • Distribution of mass (density, centre of gravity) – Making sure the weight is distributed evenly wether this be in an aircraft, by road in a truck or shipping the produce.
  • Size (bulk, length, height, depth) – Making the most of the space you have, there is no point in paying to transport produce and ship mostly air.
  • Temperature requirements – keeping the meat at the correct temperature to keep it fresh while it is being transported is vital.
  • Distance travelled/time taken (shelf life) – will the produce still be in date/ fresh to eat by the time it reaches the supermarket or place of sale?


Can animals count?

I know what you’re thinking. She must be crazy. Of course animals can’t count. However some scientist argue that animals have mathematical abilities since the claim of Clever Hans in 1891. Clever Hans was a horse who was reportedly able to give the answer to basic mathematical calculations giving the answer by stomping his foot. Have a look here here.

However this was discredited when Psychologist Oskar Pfungst noticed that the horse was using cues from his owner to determine when to stop counting. There is no doubt that the horse was smart however not at counting as first thought. But don’t say I told you so just yet because..

There is however other research to support the claim that animals can demonstrate skills in counting. The experiment which impressed me most was the chimp experiment. The experiment involved the chimps adding up the number of chocolate pieces in the bowl and selecting the bowl which had the most chocolate pieces in it. The chimpanzee succeeded 90% of the time in this task. This experiment got me thinking about how intelligent animals really are, however i’m still not convinced in their ability to actually count.

References:

Goldman, J. (2012) Animals that can count Available at:  http://www.bbc.com/future/story/20121128-animals-that-can-count (Last Accessed: 23.11.2015)


More than just a story

Stories are something that most of us would have thoroughly enjoyed as children. Stories are a great stimulus for the development of language and literacy but also numeracy. When people think about story telling they often don’t think about the numeracy development which happens throughout. The discovering maths module has allowed me to understand some of the mathematical concepts which can be developed through story telling such as time, shape, size and colour. The use of mathematical language can also emerge through stories, examples of this could be in, out, behind. An important aspect of story telling is questioning as this supports the development of problem solving skills. For example, asking the children what they think might happen next in the story? What the character could have done differently?

Discovering maths has made me think about stories which can help develop and encourage enjoyment of mathematics. A lot of traditional tales can be used as a stimulus to develop numeracy and mathematical language.

‘Goldilocks and the three bears’ can help develop the mathematical concepts size and quantity. There is repetition with the sizes and quantities, the bowls, beds and chairs. Children can relate to the small bowl being for the small bear and the big bowl being for daddy bear which develops reasoning. This also helps develop mathematical language, ‘baby bears bowl is smaller than daddy bears’

There are also great follow up activities which can relate to numeracy development. A story sequence can be a good activity  to help children not only recall the story but put the key parts into order which again is developing numeracy skills and mathematical language.