I have always known that there must be some level of mathematics behind medicine and health care, however, I did not realise just quite how important it is in the world of medicine. As the daughter of a nurse, friends of medical students and someone who considered nursing as a career, I have a basic knowledge of the aspects of maths involved in medicine.
 I went to the Royal Belfast Hospital for Sick Children for a week where I spent time in the Infectious Diseases ward, Oncology and Haematology unit as well as exploring the other aspects such as renal dialysis and lumbar puncture. During this time, I experienced maths in medicine by doing rounds of observations. This involved taking the oxygen saturation levels, blood pressure, respiratory rate, temperature and heart rate. All of which are mathematical measurements which need to be recorded to determine a score on the observation chart. As observations need to be on frequently e.g. every 2 hours, you can easily compare whether the patient is getting better or deteriorating as it forms a line graph. In primary schools, often charts are made from a tally of cars that have drove past. This is quite irrelevant as a topic, however, the skill of creating and reading graphs is developed through this which is a key skill in medicine for not only doctors but also paramedics and nurses.
 A further example of using charts in medicine is for measuring a baby during pregnancy. If there is sudden growth noticed in the chart, this will be cause warning bells in the doctor’s head. They will want to get the pregnancy checked out in a scan to see if there are any complications.
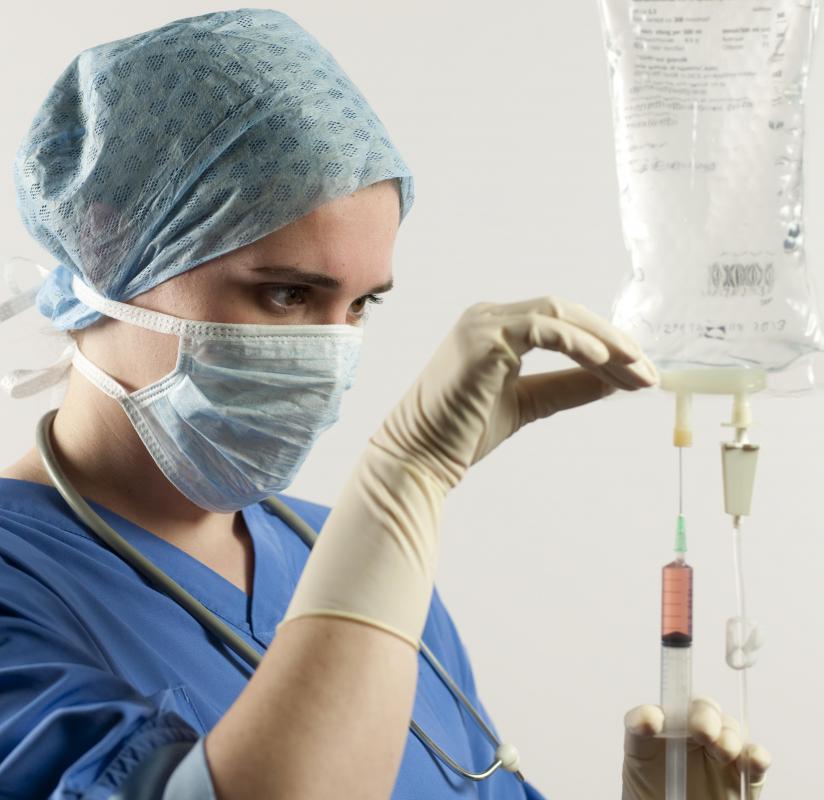 I also looked at the idea of calculating drug doses during my work placement as it is different in adults and children. For adults, initially everyone is given the same dosage, no matter their age, weight or height meaning a frail 89-year-old woman would get the same dosage as a tall, obese 30-year-old man. Whilst in paediatrics, the drug dosage is calculated per kg of weight to ensure the child is administered the correct and safe dosage. Another aspect that involves maths is intravenous drips- it is important to calculate how much fluid the patient has lost and how much they need whilst ensuring there isn’t too much fluid going in that the electrolytes end up diluted.
I have also been a regular patient at my local GP practice and have had a few hospital visits which has sparked an interest in this aspect of maths. By attending these appointments, I have been able to see maths in action rather than just reading or hearing about it. I’ve had my blood pressure taken, CAT and MRI scans and been prescribed medication. All of these require maths.
 Blood pressure is a ‘mathematical representation’ of two forces. The top number known as systolic is the force against the artery walls when the heart beats and the bottom number known as diastolic is the force against the artery walls between the two beats of the heart (this is when the heart is in a relaxed state). A blood pressure range of 110/70 to 120/80 is considered normal (Medindia, no date).

CAT and MRI scans are both types of x-ray. Maths is required here to monitor the intensity of the x-ray and to angle the rays to scan the required part of the body. When an x-ray passes through the body, it does so in a straight line. The greater the distance, the stronger the x-ray needs to be (Budd and Mitchell, 2008).
 Maths is required in prescribing medications as it is important for doctors to prescribe only enough tablets to complete the planned time e.g. a course of antibiotics for 2 weeks. An example in my life is when I went to Canada for the whole summer, I needed enough tablets to do me for 11 weeks. This required calculating how many of each tablet I need each day multiplying that by 7 and then that by 11 to determine the exact quantities I would require to ensure I didn’t have to miss out on medications.
An interesting point was brought up in this workshop about interpreting research and probabilities in medicine. We discussed the idea of statistics and risks e.g. how much your chances increase of death by smoking, being overweight etc. Junior doctors discuss these issues with patients daily yet they often don’t know the statistics and the actual risk increase of lung cancer from smoking. This means that sometimes more senior doctors need to step in with the statistics when chatting to a patient. We discussed whether it is fair to expect junior doctors to know all the statistics when they are just starting their career and how even workers within statistics only know their own area of statistics off by heart and need to look up other statistics.
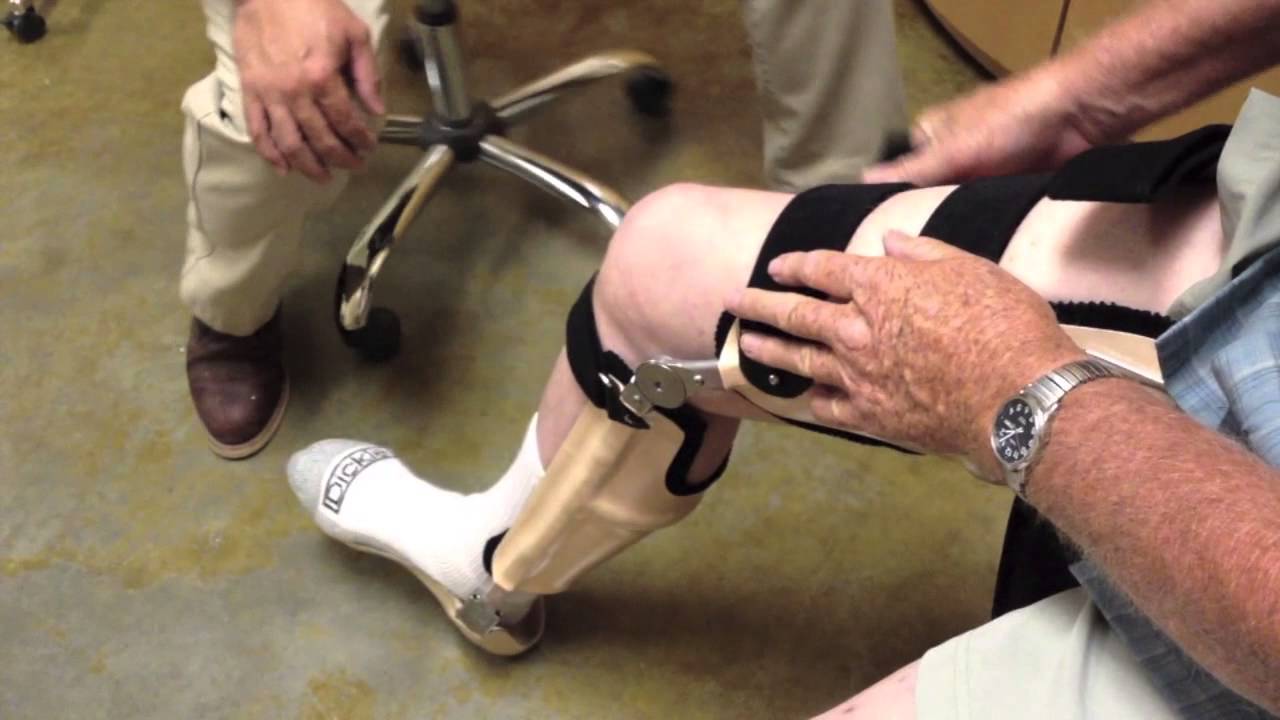 Biomechanics was mentioned during the workshop which is all about the forces required to cause fractures. We also looked at pharmacodynamics and biochemistry. This involves the amount of a medicine administered depending on how fast it leaves the patient’s body which depends on kidney function and how much the patient urinates.
 Something I was not aware of before today was the value of Twitter in medicine. Twitter has been used to discover the waves of diseases e.g. the flu. People tweet about having flu like symptoms which helps the NHS to know that in a short time, there will likely be an increase in patients coming into their local GP practice with the flu due to the spread of it. I was fascinated by this as it could be used to help predict future diseases.
![]() Maths is not only required once you are a qualified doctor, it is required even before you enter university through the UKCAT test scores, UCAS tariffs which consider your upbringing and where you live. The idea of deprivation is considered and it has been found that those from a rich area and with parents who have jobs in professional settings such as doctors, teachers, lawyers etc are the most likely to apply to medical school. However, it was interesting to see that those from a poorer background with parents in manual jobs which don’t require a degree were more likely to apply than those from a rich background with parents in manual jobs. This may be due to schemes to encourage the more deprived who are capable to attend medical school and bring in variety to the world of doctors. By having doctors who are from poorer backgrounds, it helps to break barriers as they can relate to patients and therefore the level of trust may be higher.
Maths is not only required once you are a qualified doctor, it is required even before you enter university through the UKCAT test scores, UCAS tariffs which consider your upbringing and where you live. The idea of deprivation is considered and it has been found that those from a rich area and with parents who have jobs in professional settings such as doctors, teachers, lawyers etc are the most likely to apply to medical school. However, it was interesting to see that those from a poorer background with parents in manual jobs which don’t require a degree were more likely to apply than those from a rich background with parents in manual jobs. This may be due to schemes to encourage the more deprived who are capable to attend medical school and bring in variety to the world of doctors. By having doctors who are from poorer backgrounds, it helps to break barriers as they can relate to patients and therefore the level of trust may be higher.
During university assessment, maths is required to calculate pupils’ scores and determine if teaching is sufficient. For example, medical students sit a 360 question multiple choice test which is then analysed. It may be found that most students answer D to a question but the “correct” answer was A yet nobody chose this. The medical school would then need to consider why this was and determine if students were in fact correct. Medical students perform OSCEs which are scenario based exams where students go to different stations and must respond to the patient’s case accordingly. Medical schools must determine what is an adequate pass mark to ensure that all students who pass are practicing medicine safely.
 Statistics play a huge part in medicine and predicting future illnesses and life expectancies. Life expectancy is calculated by taking the average age of death for everyone that year e.g. if the average age of death was 76.9 in 2017, then the life expectancy for babies born in 2017 would be 76.9. It has been seen that men tend to die approximately 5 years younger than women. This may be due to men, in general, being worse at visiting the doctor and waiting longer to seek help if they have a health concern. Living in a poor area has also been shown to decrease life expectancy, particularly if you are male.
 Maths in Medicine could be explored in the classroom in various ways. Role play could be used where children run a doctors’ clinic and must prescribe the correct number of tablets to each patient. Medicine could be brought into maths problems where students must determine how much IV fluid is required to keep a patient healthy. Pupils could consider the different angles required to x-ray a particular part of someone’s body. Older pupils could look into health statistics and even create their own surveys for a topic such as healthy eating or exercise within the class. They could look at the average, mean, median and mode of these figures. Maths is clearly a skill required in medicine and we need to educate pupils on this as for all we know we could be educating a class full of future doctors!
Budd, C. and Mitchell, C. (2008) Saving Lives: The Mathematics of Tomography. Available at: https://plus.maths.org/content/saving-lives-mathematics-tomography (Accessed: 9 November 2017).
Medindia (no date) Blood Pressure Calculator. Available at: http://www.medindia.net/patients/calculators/blood-pressure-calculator.asp (Accessed: 9 November 2017).