1. The graph below shows how the speed of an object varies with time.

Which parts of the graph show:
(a) constant speed
(b) speeding up
(c) slowing down?
2. At a greyhound racing track, the greyhounds are automatically released when an artificial hare crosses the starting line.
The speed-time graph shows the motion of one greyhound and the hare from the time when the hare crosses the starting line۔
(a) How long does it take for the greyhound to start moving after the hare crosses the starting line?
(b) Calculate the acceleration of the greyhound when it starts moving.
(c) The hare crosses the finishing line 20s after crossing the starting line.
(i) Over what distance is the race run?
(ii) How far behind the hare is the greyhound when the hare finishes the race?
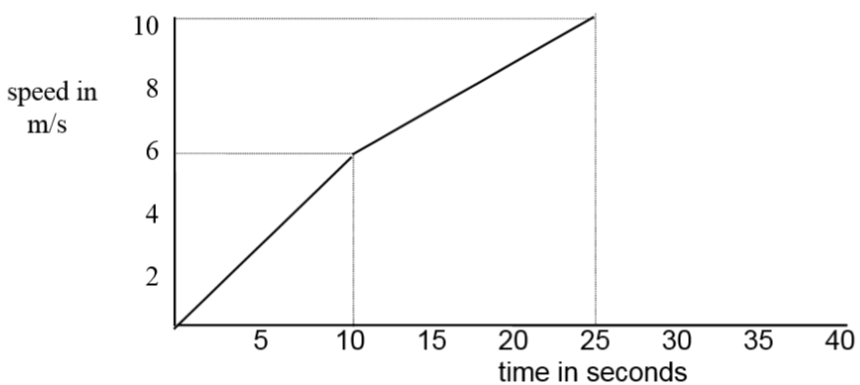
3. The graph below shows part of the journey of a car as it leaves the traffic lights.

Use the graph to:
(a) Describe the motion of the vehicle during the first 25 seconds of its journey.
(b) Calculate the acceleration during the first 10 seconds of the journey.


