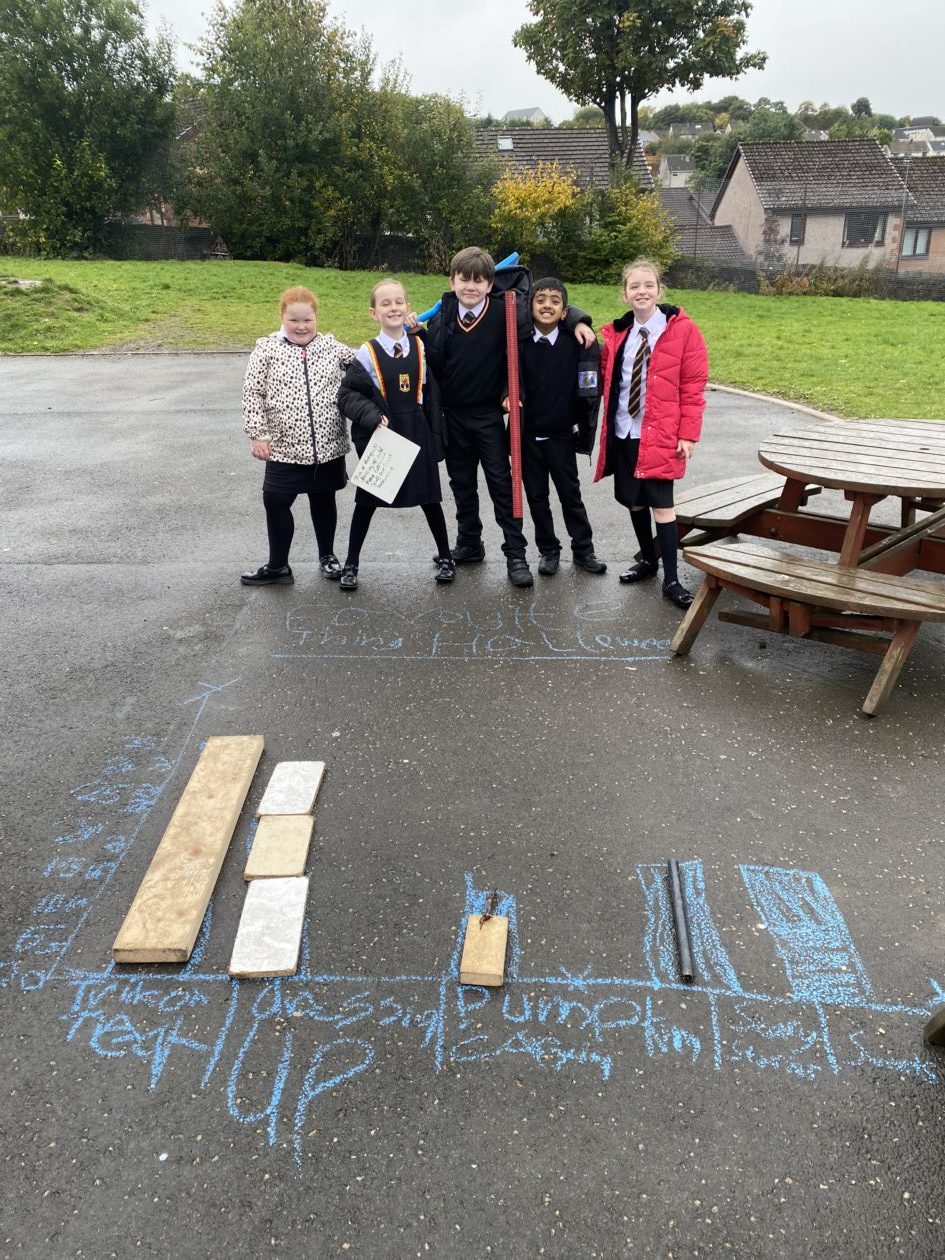
During Outdoor Learning we created bar graphs thats reflected the results of our class surveys about Halloween. We surveyed numerous classes about their favourite aspects of the festival, then collated the results in class. We decided to experiment by creating the bar graphs outside before we did so in our jotter or digitally on the chrome book.


