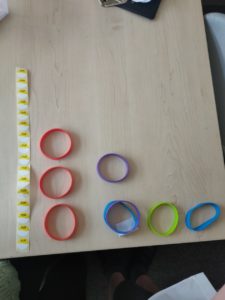
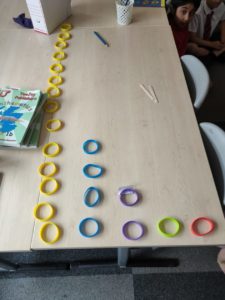
We have been using the lunch bands to create ‘bar graphs’ and answering questions about the data.
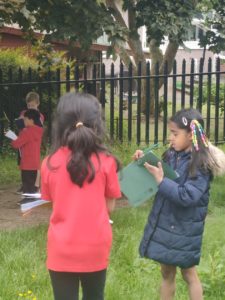
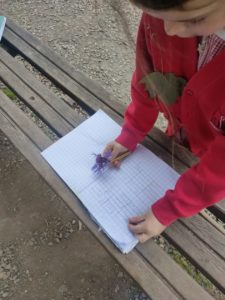
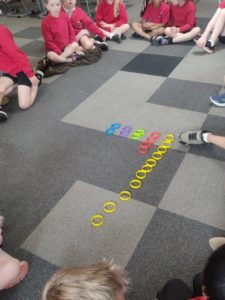
We collected data in the woodlands about colours and shapes then created bar charts.
We have been using the lunch bands to create ‘bar graphs’ and answering questions about the data.
We collected data in the woodlands about colours and shapes then created bar charts.