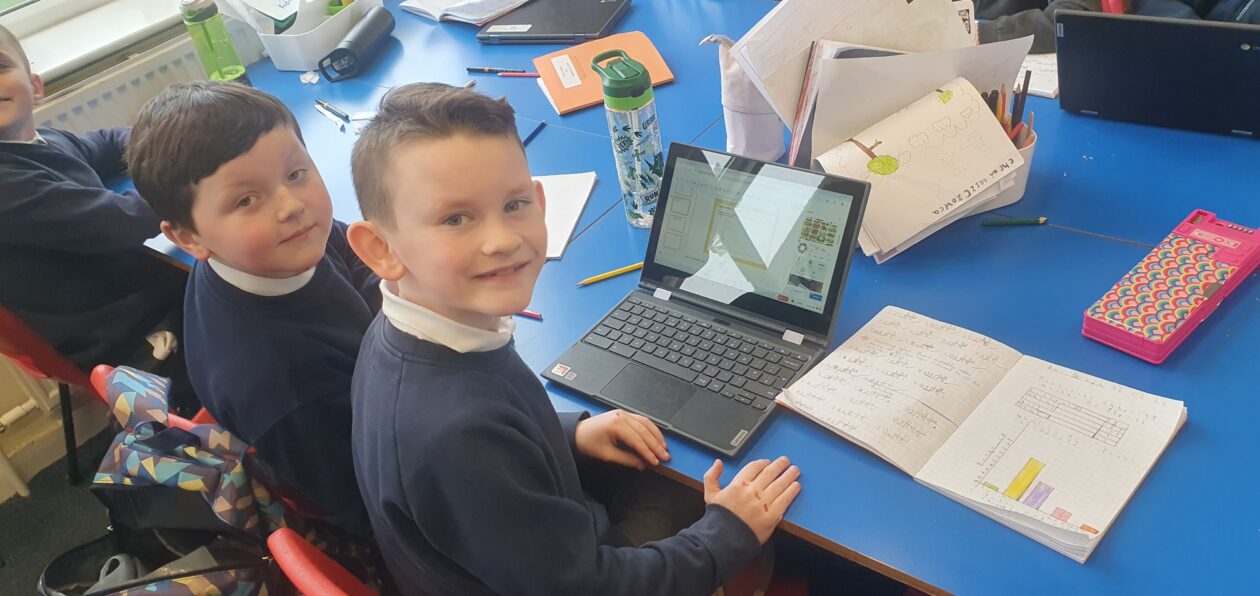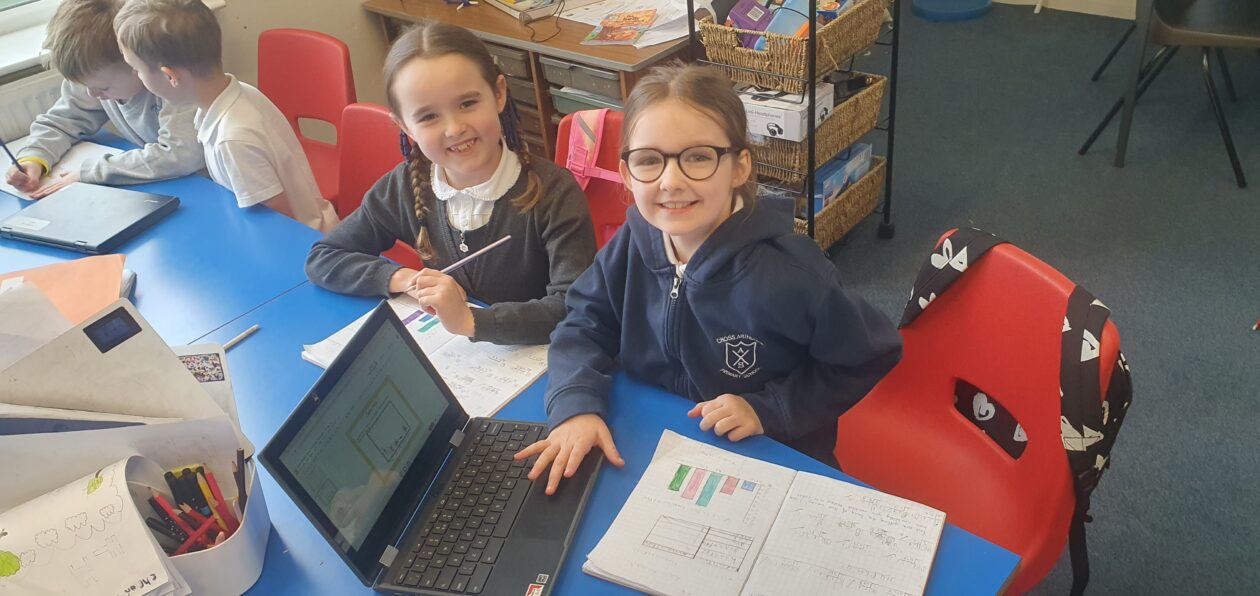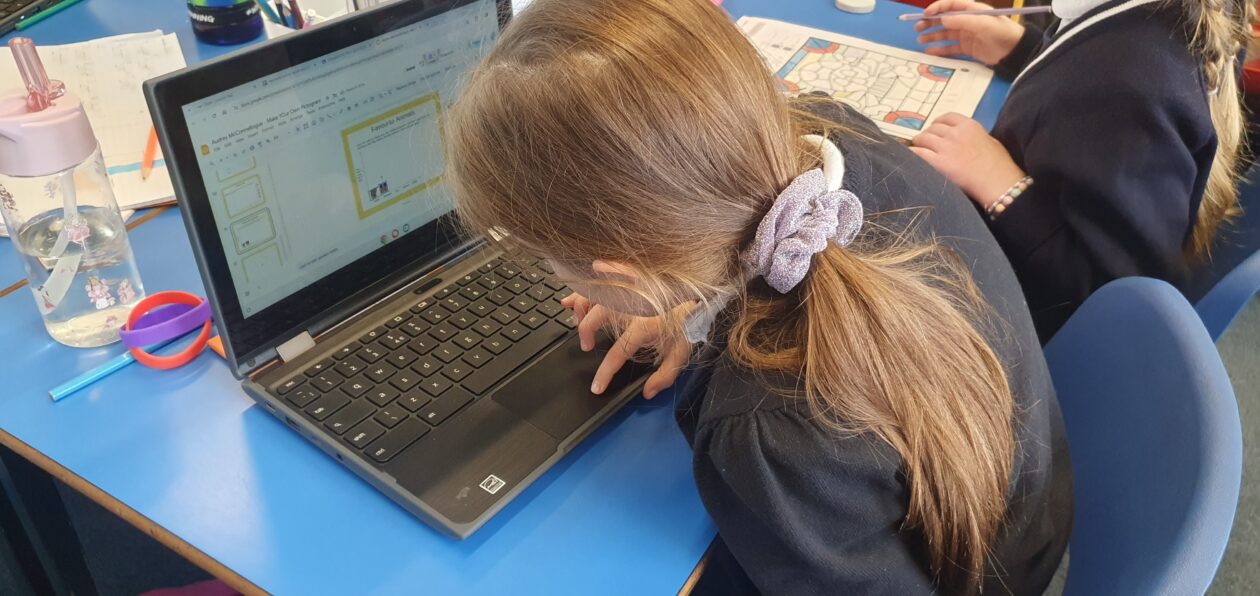
Some children have been exploring the various ways we can collect data. Pupils are used to holding surveys orally so this time, we created a Google Form and sent it to various classes through Google Classroom.
We were excited to see the results to our questions come in. We had made predictions about what answer may be the most popular.
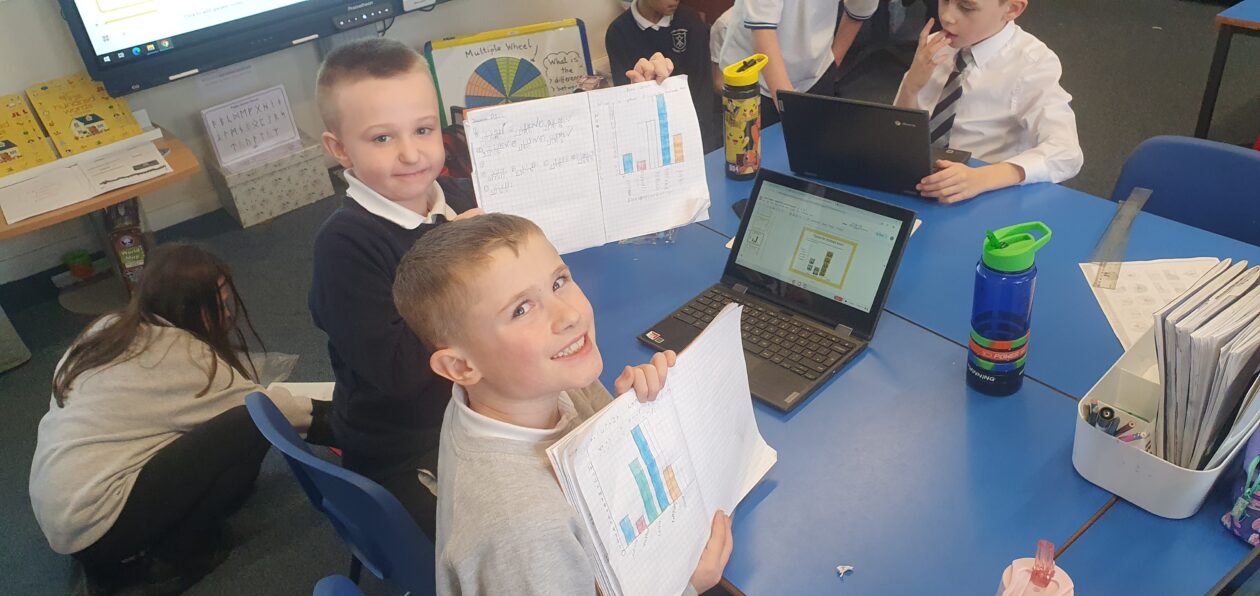
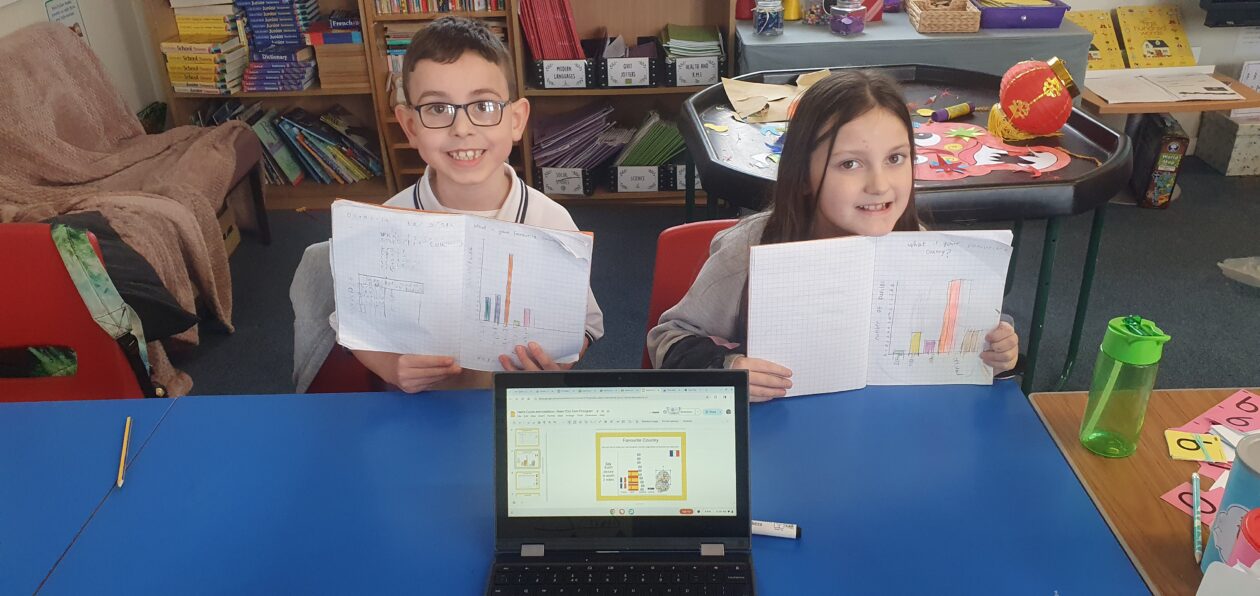
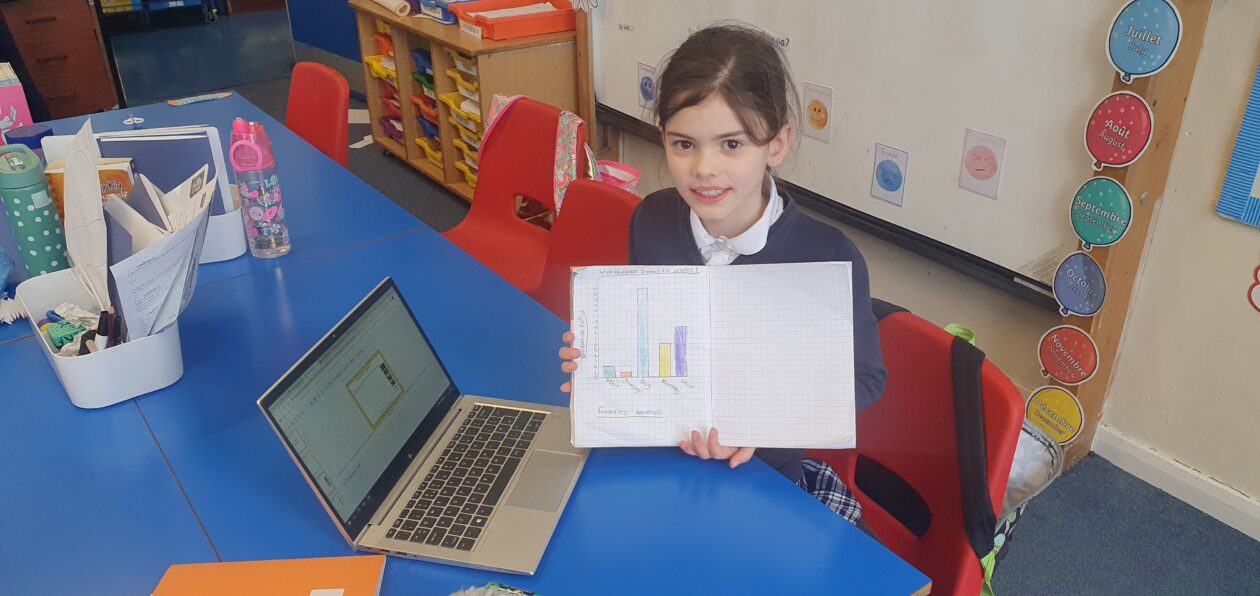
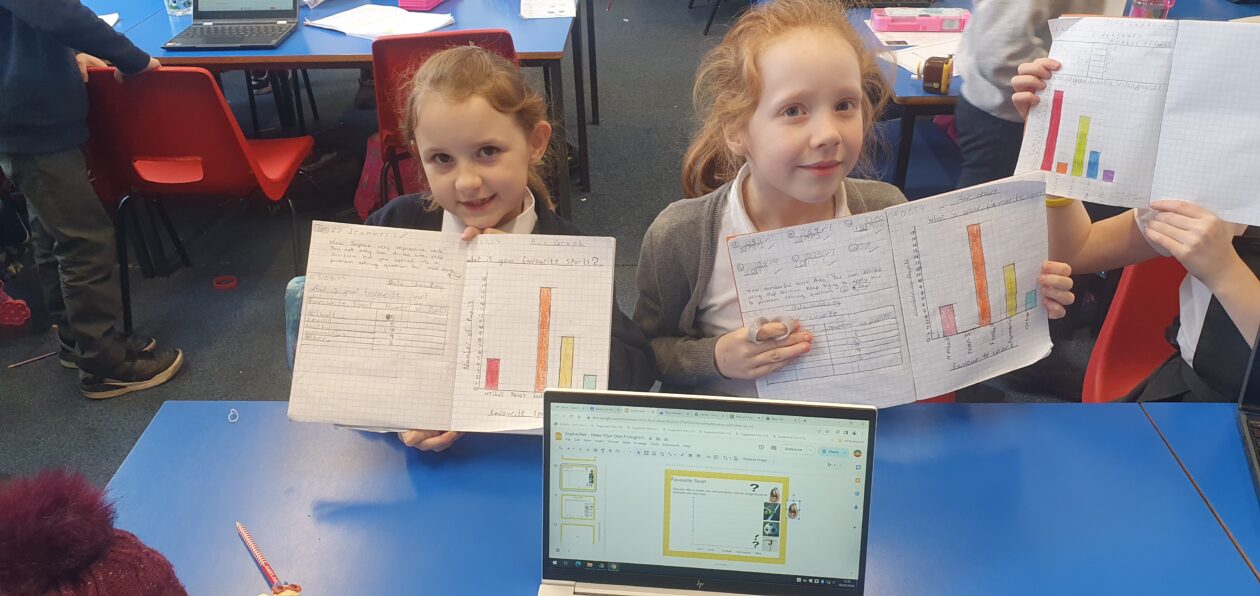
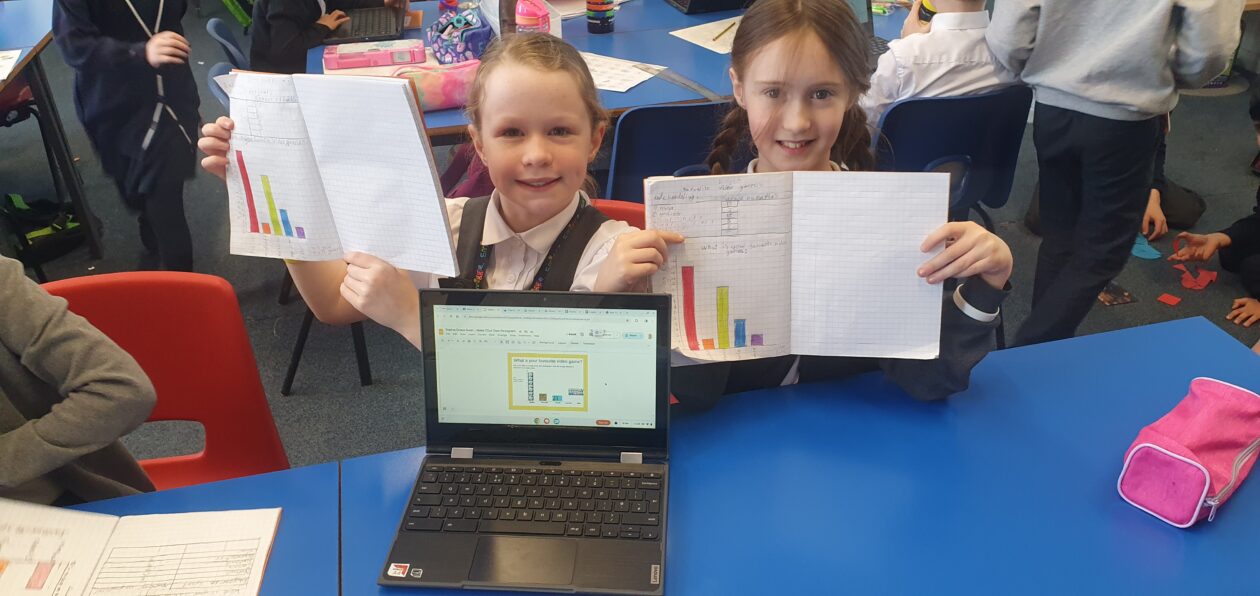
We created a frequency table and a bar chart in our jotter, revising what we had learned from P3. We then learned how to recreate this on a spreadsheet on Google Sheets. We made sure our bar chart had a title, axis titles, and borders.
Finally, we used Google Slides to place our results in a pictogram. Through Maths, we have been learning lots of technology skills. We are much better at formatting text and pictures in a range of software. We are beginning to use more keyboard shortcuts!