We really enjoyed building Robots and then using Lego Mindstorm to programme them.
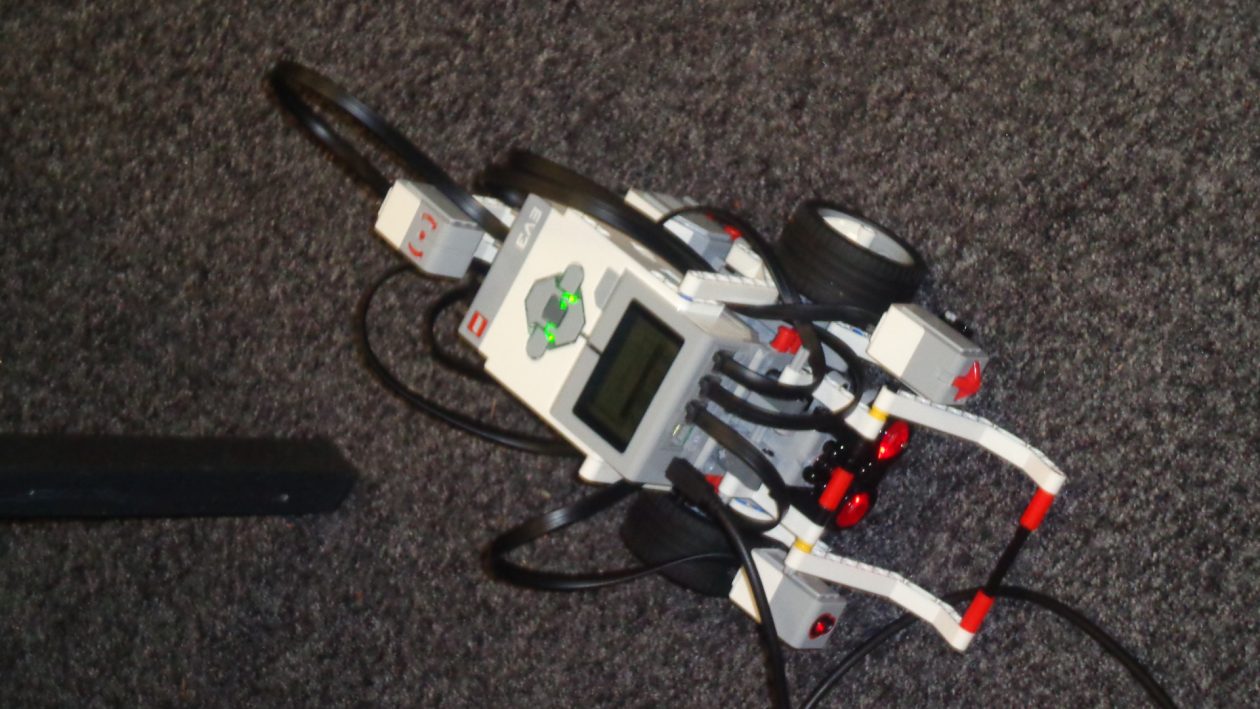
We really enjoyed building Robots and then using Lego Mindstorm to programme them.
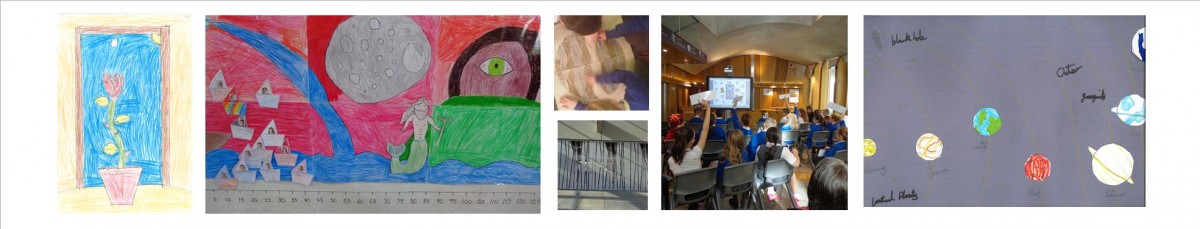
As part of our science topic on Buoyancy we were challenged to design a boat using recycled materials. Our boats also had to be able to hold a cargo. Some of us worked as part of a group and others chose to work independently. We really enjoyed designing the boats and sharing the finished boats with our peers.
We have been learning Mandarin based on our previous lessons
Our main focus has been Mandarin characters we have been able to create our own Mandarin characters for example fire + mountain = volcano
and one person + another one = following. We recently went down to P2 and P4 and showed our presentations about mandarin.
I enjoyed one symbol + another symbol = another symbol
Ryan
I enjoyed showing off our mandarin skills to P2 and P4
Codi
There once was a皇帝 go-wan who lived near the大山Dàshān near 山shān the was a 森林Sēnlín and in森林Sēnlín there was a熊貓Xióngmāo the had a best-friend his friend was a 人Rén their favourite food is白饭 mi
and Zhú竹.One night when the 亮Yuèliàng was shining really bright the皇帝 go-wan got lost in the森林 Sēnlín
BY Codi, EmmaB, Olivia, Sophie
One day I went to a big大Dà zoo. In the zoo I saw an animal. It was big (da) and it was white白色Báisè and 黑色Hēisè 。 I asked my沉默Chénmò.What is that? My Chénmò said it was a panda( Shumao). It was eating竹
竹Zhú.It began to climb up a 绿色的树Lǜsè de shù .
by Julia, Racheal, Amy, EmmaF,Breanne
We utilised our ICT skills to create animations based on our short stories.
We will be able to use these skills in the future to help us communicate with Chinese people and in some jobs being bilingual is an asset.
Copy of Breanne Scatter Graph Blackpool
This week in ICT Primary 6 researched the rise of the population within Blackpool during the Victorian period. The rise of the population was due to the invention of the steam train and the construction of railway lines and other transport methods such as the tram.
We decided to display our information using a line graph. We learned how to utilise Microsoft Excel to display the data. Our graph shows that improvements to the railway and other amenities resulted in a substantial rise in the population of Blackpool.
I enjoyed creating the graph because I am more confident in using Excel and I liked making it colourful Breanne
I was successful at creating my graph because I included a title and labelled my x and y axis. Olivia
We plan to carry out a survey about transport in the modern day and compare with transport utilised in the Victorian period. This will develop our understanding of data handling and the past.

Glow Blogs uses cookies to enhance your experience on our service. By using this service or closing this message you consent to our use of those cookies. Please read our Cookie Policy.