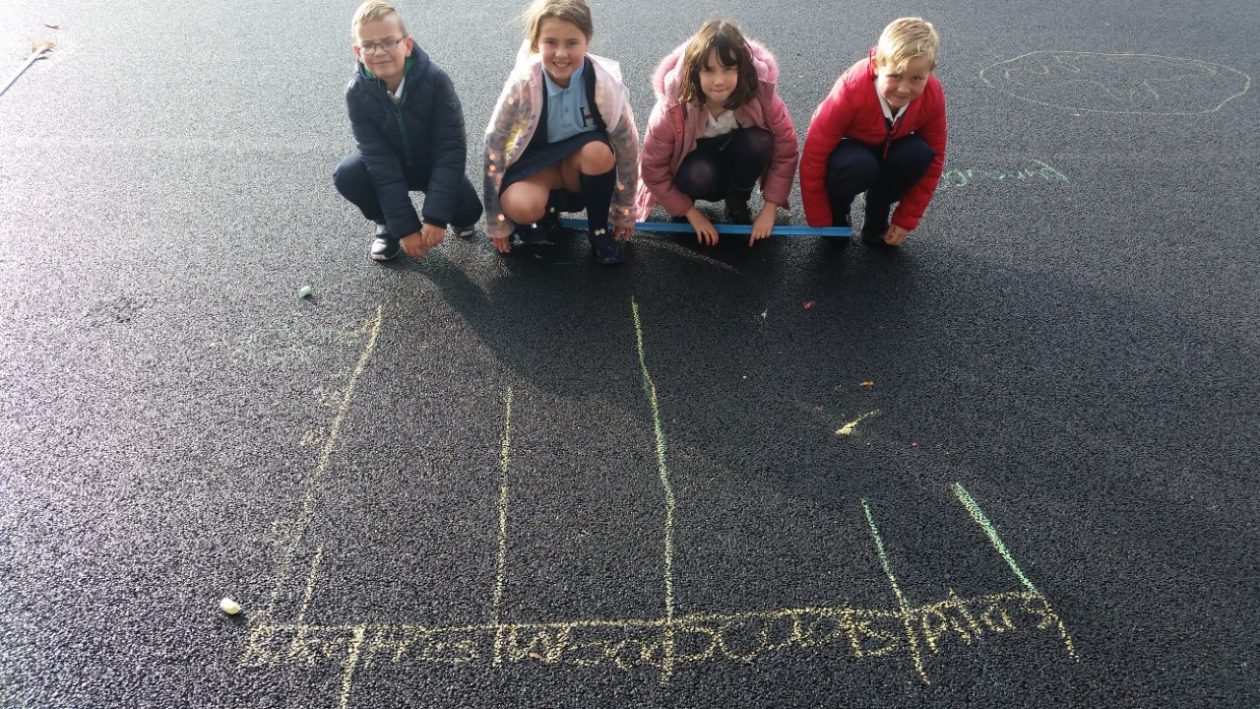
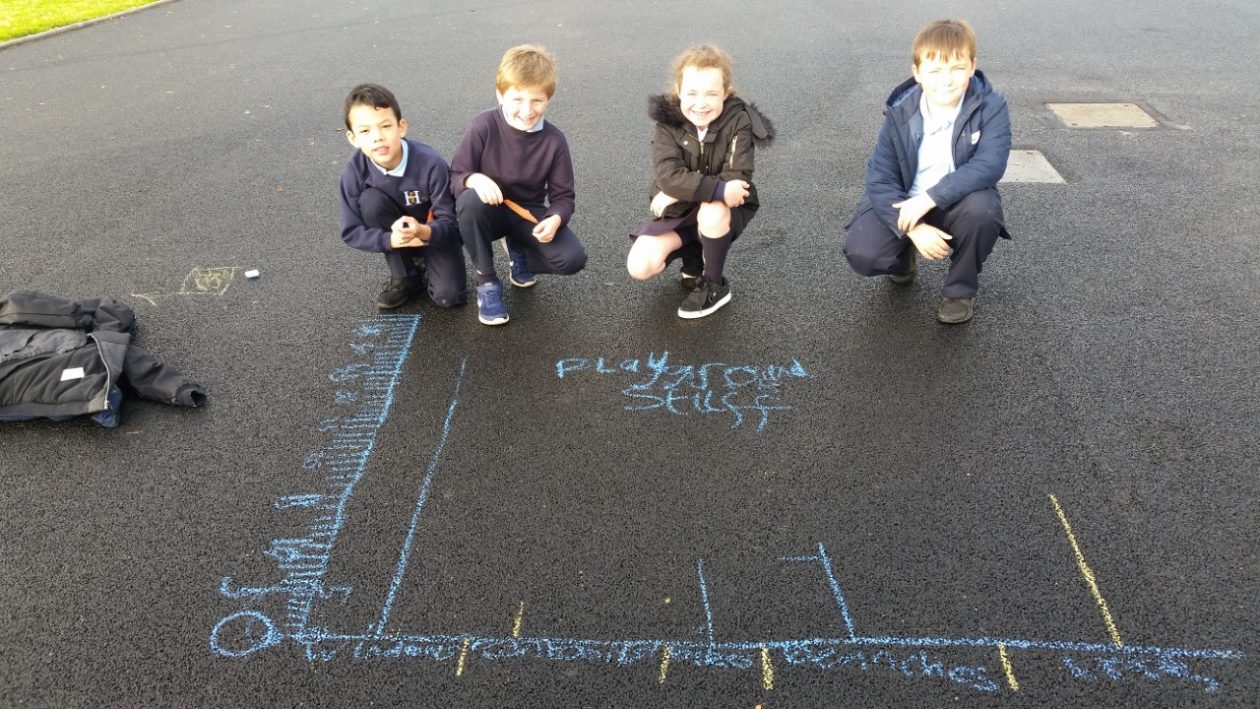
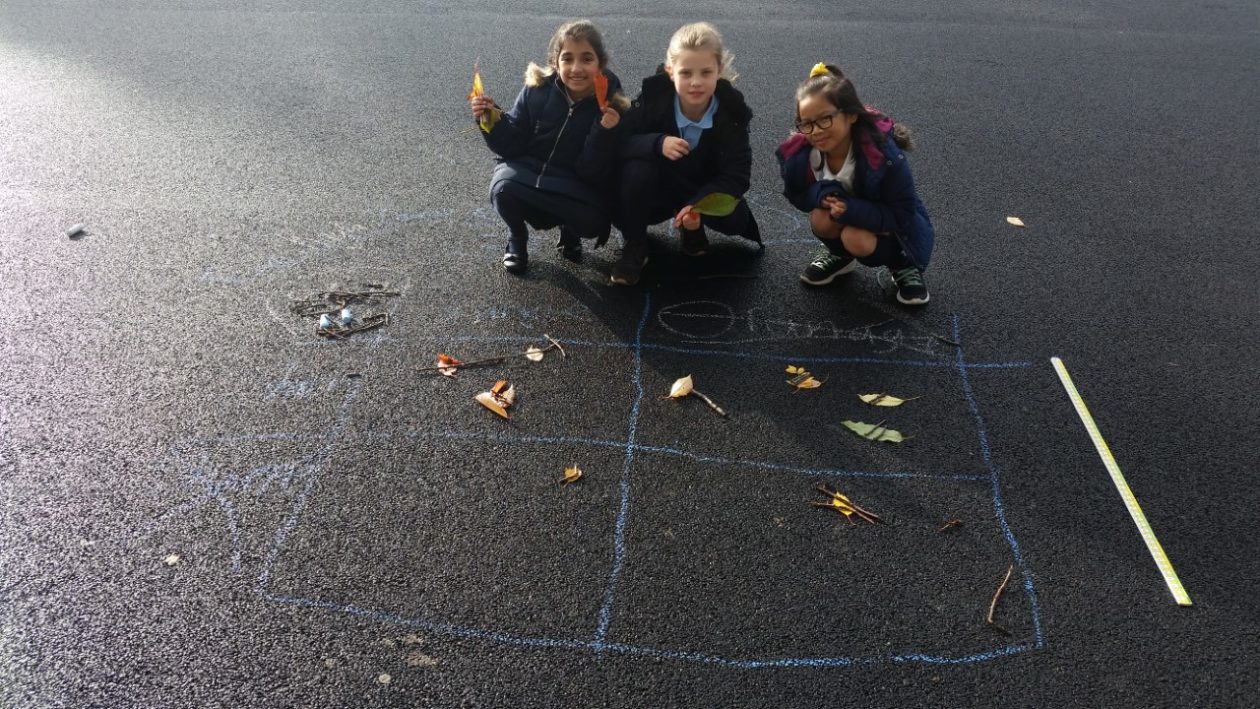
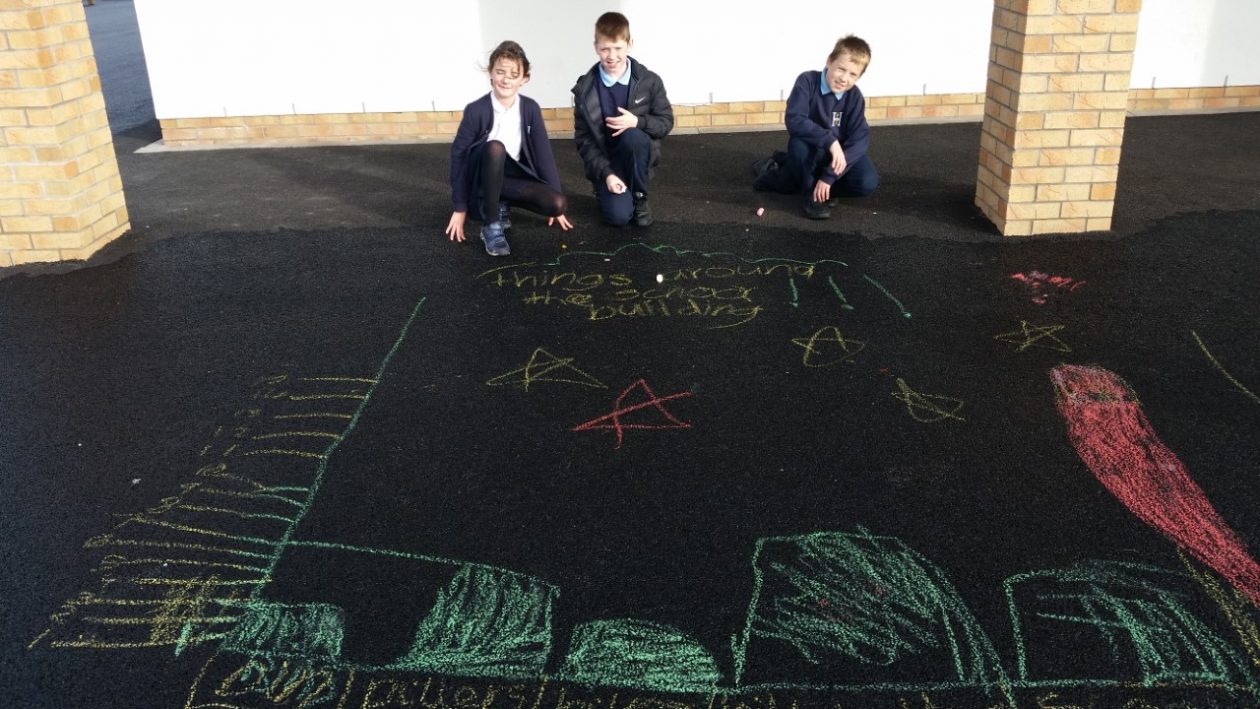
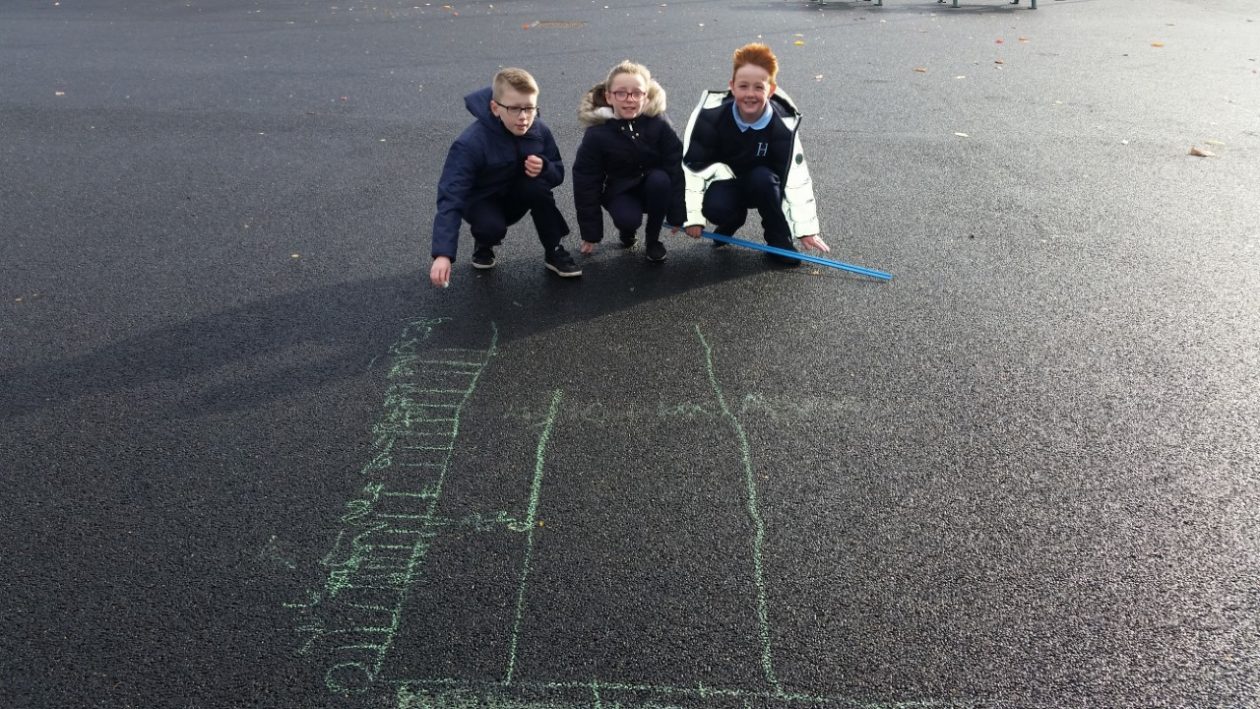
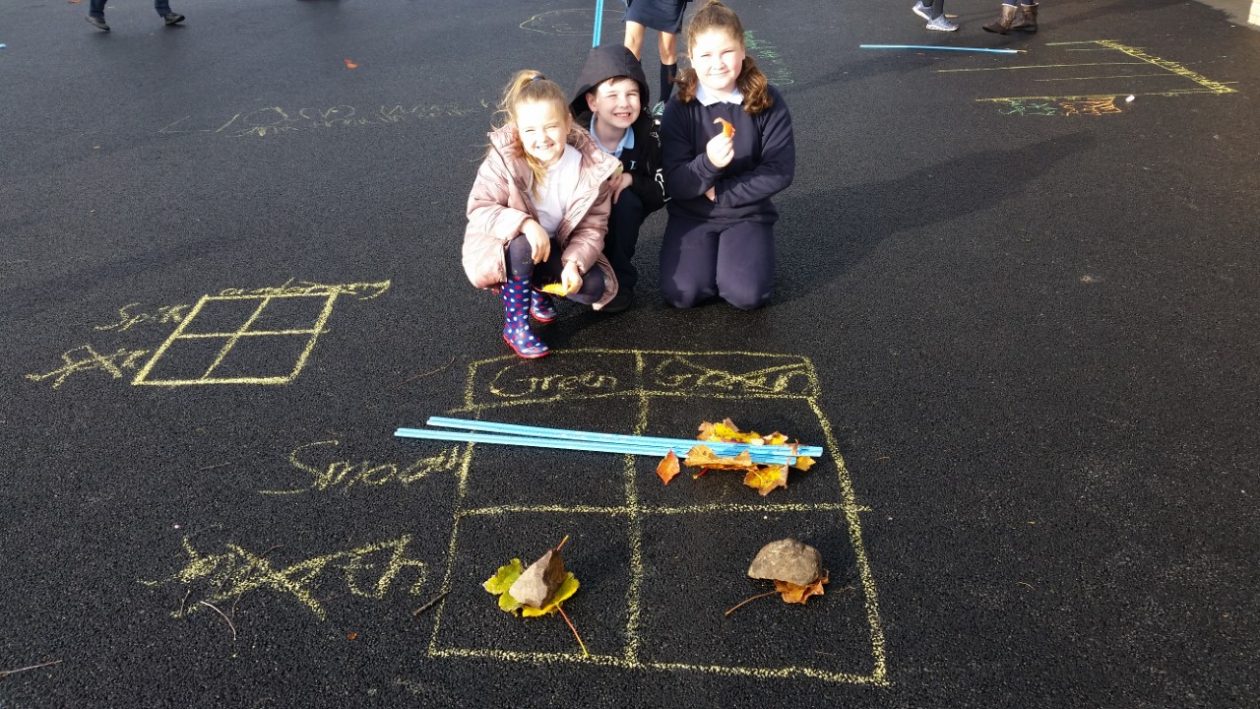
After learning about Bar line graphs and Carroll diagrams, we went outside to further test our skills. Here are some photos of us creating Carroll diagrams about natural materials we found outside and Bar line graphs of things relating to the school building e.g how many windows, pillars, bike stands etc. It was a bit windy but we managed to do a good job!