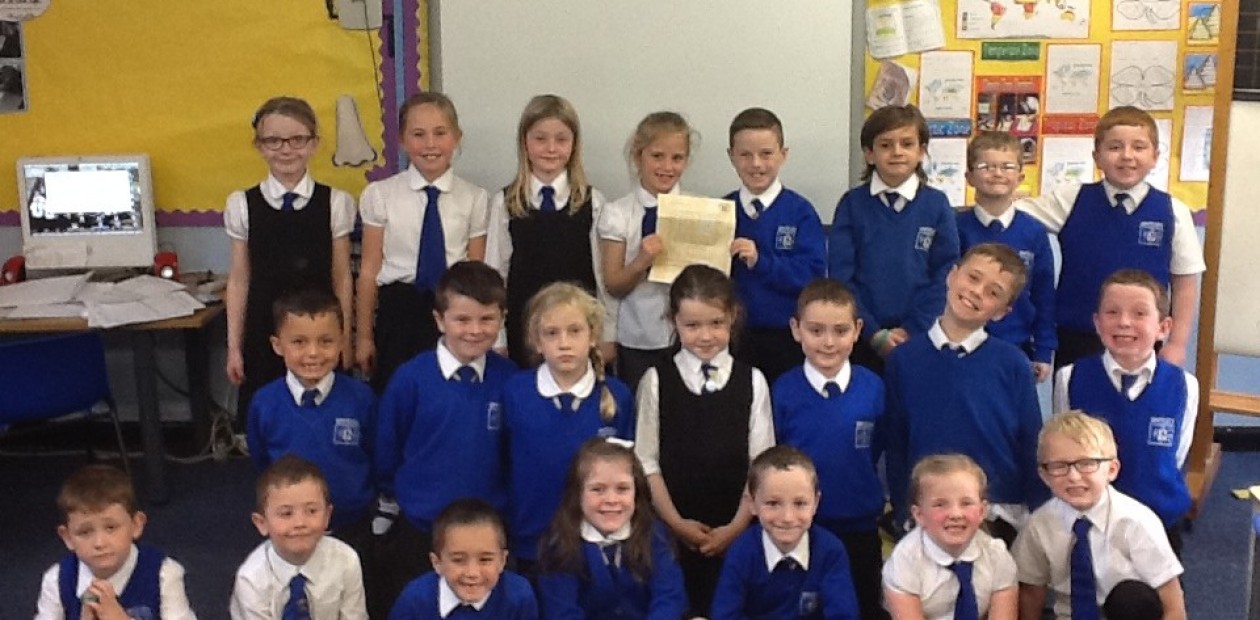
P2/3 have been learning all about data handling. P2 can create their own bar charts, carroll and venn diagrams to show data. P3 can create all these ways of presenting data AND use them to answer questions about frequency, most and least common items and many more . They used a range of jotter work and active learning to learn all about Data Handling. They really enjoyed doing whole class diagrams on the board, especially the brothers and sisters carroll diagram. They even figured out where Mr Young’s name would go !


