Climate Change and Carbon Footprints

A carbon footprint is the amount of carbon dioxide (CO2) released into the atmosphere as a result of the activities of a particular individual, organisation or community.  This week we were tasked with calculating our own carbon footprints, and to do this we used the WWF measure your footprint website.  It asked questions like:

  • How many people live in our home
  • What kind of transport do you use and how often
  • Do you buy locally produced food
  • How do you heat your home
  • How often do you buy new things (e.g TVs or computers)

Then once you had completed the quiz you were given a score in percentage compared to the rest of the world.  I did the quiz twice, the first time i used my family home and the second time I used my student accommodation.  For my family home I received a score of 76%.  This means that it is around half of the UK average but nearly double the worldwide average in tonnes of CO2 produced, my family home produces around 8.1 tonnes of carbon a year.  My student accommodation flat received a score of 96%.  This means that my flat produces 10 tonnes of carbon every year, that’s 4 tonnes less than the UK average and double the worldwide average.  There were some questions that I wasn’t sure of the answer, for example I said that the flat was heated using electricity but I don’t know if that’s right, so the score might not be totally accurate.  This activity would be quite good to do with kids as they could work out the carbon footprint of their own homes (if they found out all the information needed) and then compare with the other children in the class, then they could work out ways in which they could reduce their carbon footprint at home.

BP carbon footprint toolkit is another resource for calculating carbon footprints.  This one is good for calculating the carbon footprints of schools so it would be a good one to do in class.  The children can split up into groups and go around the school looking for the information they need to carry out the task.  One the score has been calculated the children could discuss ways in which the schools score could be reduced, and if possible it could even lead to new programmes such as a recycling club.

A good resource for showing the effects of climate change in ‘Antarctica on the edge’ which is a video that lasts about 24 minutes and follows a team of scientists as they go around the antarctic taking samples and reviewing the changes in the pole.  The video was really interesting and one thing I never knew was that ice could go rotten (where air bubbles are trapped as the ice freezes and causes the ice to be more brittle and porous).  I would definitely use this video in a classroom environment when teaching climate change as it was easy to understand and very interesting and I think that children would engage well with it.

After looking through these resources I realise that I have a reasonable carbon footprint but there is room for improvement.  I will look at ways in which I can reduce my carbon footprint so as to help the environment but also to set a good example to the children I will someday teach about climate change and eco-friendliness.


References

http://footprint.wwf.org.uk/?_ga=1.176985891.745195644.1442412124

http://bpes.bp.com/secondary-resources/science/ages-12-to-14/earth-and-atmosphere/carbon-footprint-toolkit/
Climate Change

The second topic of the module was all about climate change.  We looked at the effects and impact of climate change, the links between climate and the environment and the greenhouse effect.  In the first workshop there were six different work stations with different activities that we went round.  Before that though the whole class took part in a ‘Biome Survival Activity’.  For this we were separated into smaller groups and each group was given a biome in which they would have to survive after a plane crash.  The task involved us researching the abiotic factors of our crash site: air quality, water supply, light, radiation, temperature, humidity, atmosphere and soil as well as the biotic factors: plants (producers), and both herbivores and carnivores (consumers).  The other aspect of the task was that we were do describe in detail how we would survive for three weeks in our biome with only a few items that were saved from the plane wreckage.  This activity was good fun but took a long time and meant that it was left unfinished.  I think that this activity would be quite good to use in a classroom but it would either have to be done over a number of lessons or some of the activity would need to be changed or removed.  Perhaps giving information sheets on the biome to avoid lengthy research times or simpler questions to avoid confusion.

After we had spent some time on the survival activity we began moving around the room to do the other activities.  The activities were as follows:

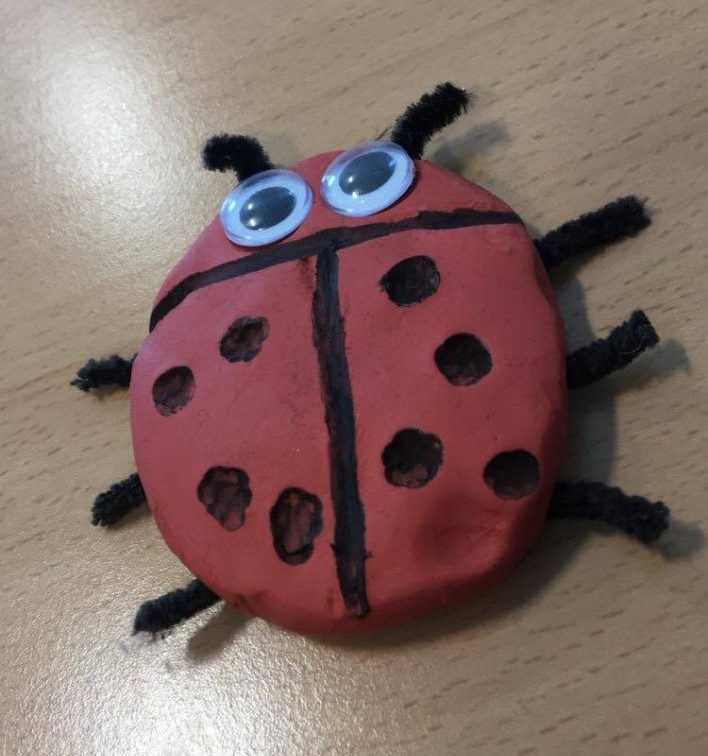
  1. Create an animal – this was where we were to choose a type of biome and use various materials to make an animal that lives in that biome, e.g Polar Bear for Tundra
  2. Homemade tornado – here we used a clear jar with lid, fairy liquid and food colouring to create a visualisation of a tornado
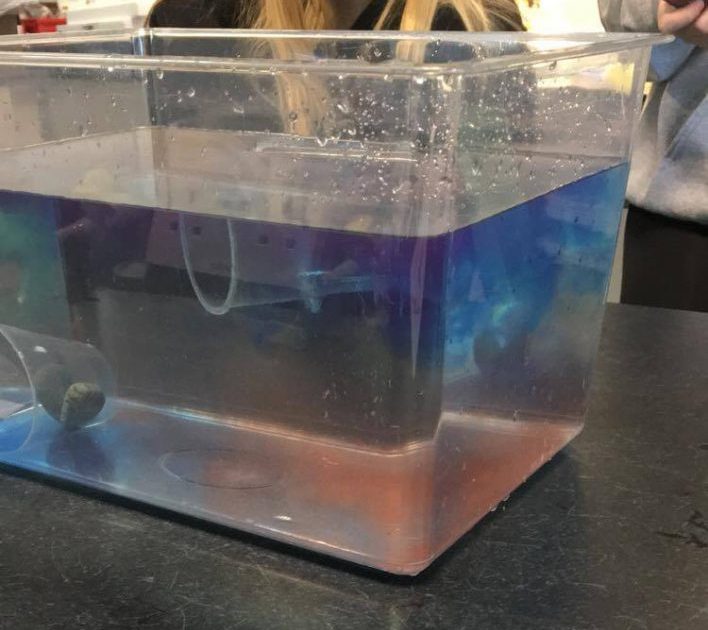
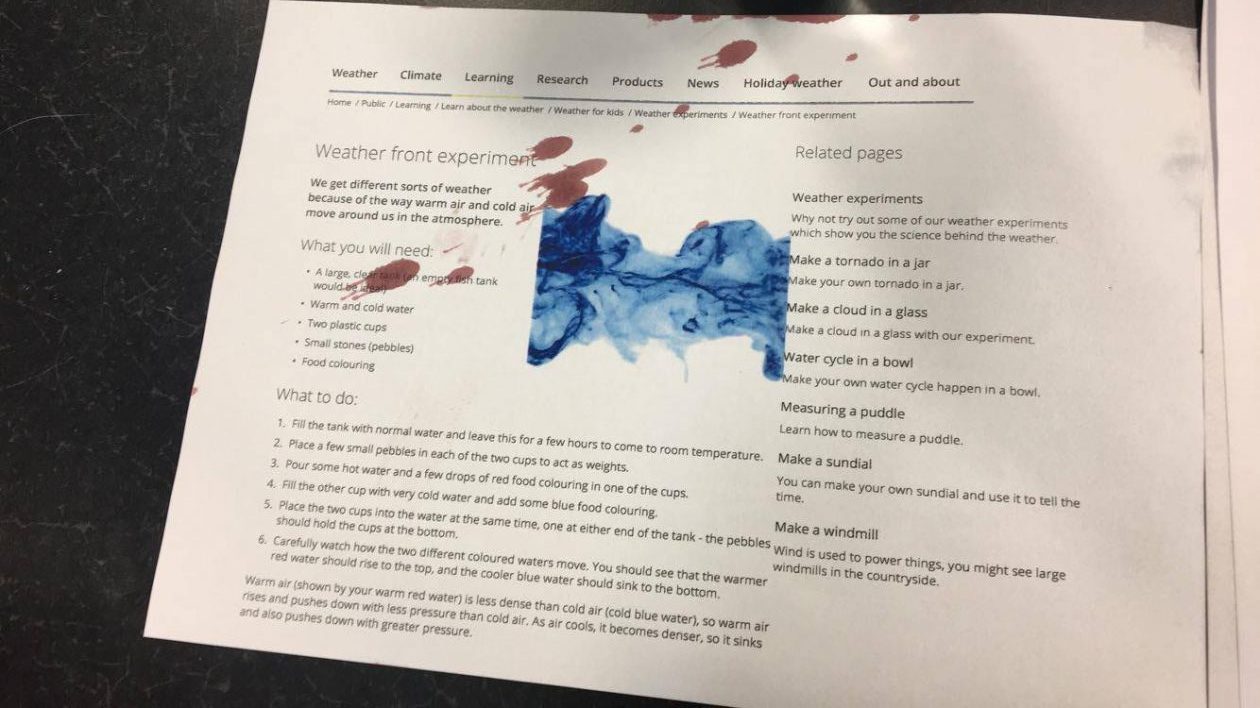
  3. Weather front – this was where we had a large clear basin of room temperature water.  We had a plastic cup with hot water and red food colouring and a cup with cold water and blue food colouring.  Each cup had a few pebbles in it the keep them weighed down.  When the cups were placed in the basin the cold water sank to the bottom and the warm water rose to the top.  The different types of water represent cold and warm weather fronts
  4. Climate Quiz – this was a short quiz with different questions for answering misconceptions with climate change
  5. Debate Table – this was where the groups had a discussion about misconception cards about climate change, I didn’t get to this table
  6. Air resistance – this was where you had to create two identical snowflakes from paper, then you scrunched one up into a ball and dropped them from the same height.  The aim was to show how air resistance works and that’s why snowflakes and hailstones (scrunched up snowflake) fall at different rates

Doing small and easy activities like this is a great way to pack lots of information into a small time frame.  Rather than having one big experiment where the kids just stand and watch, by having lots of small ones it means that they can get their hands on experience and will more times than not, remember the information more than if they were standing round a table watching the teacher.  I think that I will use the majority of these experiments in a classroom as they are really simple and easy to prepare, carry out and understand.

The second workshop was all about climate change and politics.  We looked at government actions, mitigation, adaptation, effectiveness, international issues and the north-south split.  Then as an activity each group was given a stakeholder and were tasked with finding the impacts of climate change that would effect those stakeholders the most.  Our group was given the stakeholder of an elderly couple living in New Orleans.  We looked at the council of foreign relations website, NASA imaging, World resources institute, climate hot map and the Kyoto and Montreal protocols to help us identify which issues would be more prominent for our elderly couple.  We decided that the increase in temperature would be a worrying factor for the couple as with increasing temperature comes illness; specifically heat stroke that effects the young and the elderly.  Weather is also affected by temperature increase as hurricanes and tropical storms love warm weather and would become increasingly common.  This would mean that the couple would be worrying about evacuation and hospital treatment if such weather anomalies occurred.  There were of course other things that would effect the couple for example: insurance rates would become higher or in some cases insurance would not be provided at all as the premium would be ridiculously high and agriculture would be effected leading to some food becoming unavailable leading to poor diet and in turn leading to illness and hospital treatment and hospital overloads.

Whether we want to admit it or not, climate change is happening and we need to do more to reduce its impact.  By teaching children about climate change we can mould them into greener people and help them to reduce their own impact on climate change and the worlds impact too.  Teaching climate change can be a touchy subject to talk about as some people believe that it should be left to the upper end of the school to avoid scaremongering (talking about natural disasters and events causing death etc.).  I, however believe that we should teach children about climate change and how they can help reduce it as soon as they start school.  All you would have to do is provide age appropriate information in a way in which the children will understand and remember it.  For example, if you ere teaching 1st level about climate change then you could present the information as a story, perhaps about a polar bear who’s house is slowly being destroyed or a family of penguins who have to keep moving because the ice is melting.  Once you have read the story you can go on to explain to the children that these things are happening in real life and not just in story books, and that it is happening because of climate change and global warming.  As the children move up the school you can use more adult language and incorporate percentages and figures into the equation so they are getting a level of information.

The only way we can help our planet is to teach our planet!

Report a Glow concern
Cookie policy  Privacy policy

Glow Blogs uses cookies to enhance your experience on our service. By using this service or closing this message you consent to our use of those cookies. Please read our Cookie Policy.