Most private sector businesses have the aim of making profit. To be able to make profit, the money made from selling products has to be more than the money paid out in expenses (costs):
Profit = Sales – Expenses
Businesses work out the break-even point to find out how many units of a product they have to sell before they start to make a profit. The break-even point is when:
Total Costs – Total Revenue (the amount received from sales of products)
Types of Costs
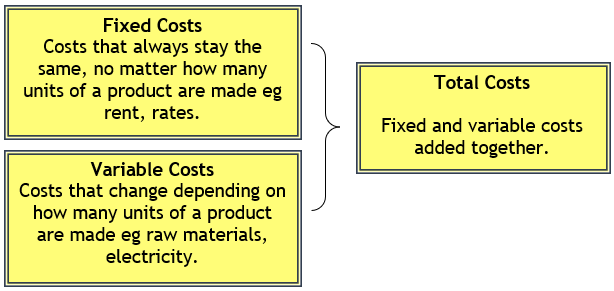
Costs is another name for expenses; money going out of the business. We need to know about three types of costs: fixed, variable and total costs.
Revenue
Revenue is the name given to the money that a business received through selling a product. The more sold, the higher the total revenue will be.
Total Revenue = Selling Price x Units Sold
The business must pay all their costs before they can make a profit.
Example: A business has costs of the following
Fixed Costs – £12,000
Variable Costs – £18,000
Then Total Costs will be £30,000
- If the business sells these goods for less than £30,000 they will make a loss.
- If they sell the goods for exactly £30,000 they will break even.
- If the business sells the goods for more than £30,000 they will make a profit.
The Break-even Point is where costs and total income are the same. At this point the business has not made any profit or loss.
The break-even Point (BEP) is calculated so the firm can forecast the level of profit or the level of lost at a given number of items being produced. It is also useful to help decide the selling price of a product and the different effects changing the price will make!
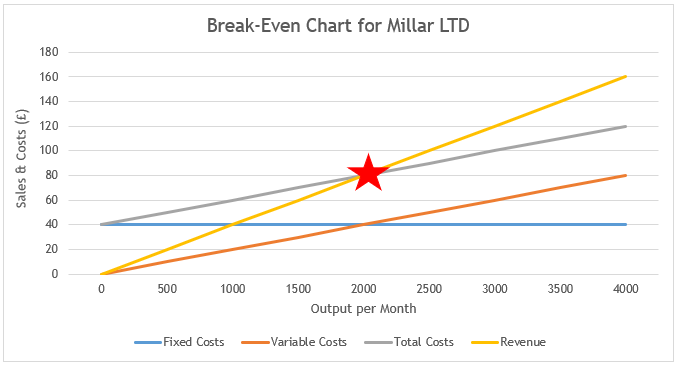
Normally break-even is shown in the form of a chart like the one below:
Interpreting the Break-even Chart
Have a look at the breakeven chart on the previous page. There are 4 lines on each breakeven chart. In this example:
The Yellow Line represents the total revenue (income/money) and always starts at 0 as if you sell nothing, you have no money coming in
The Grey Line represents the total cost at each level of production (Total Costs is fixed costs and variable costs added together)
The Blue Line shows the fixed costs which must be covered if even if no products are sold and that’s why it is shown as a straight line
The Orange Line represents the variable costs, these are the costs which change with the level of production
The Red Star is the BREAK-EVEN POINT – the point at which total costs and total revenue is equal. Before this point, the business is making a loss, after it the business is making a profit.


