Category Archives: Oh yes, this is Maths!

Demand planning (making thousands selling baked beans!)

We looked at demand planning, which is a model to try and create reliable forecasts. So we got put into pairs and were given four sheets with certain foods and drinks which we could buy and therefore sell in our shops. It was spread out throughout a year and split into quarters.

We looked at what time of year it was and tried to make predictions on what items would sell most and what items would not sell. Every quarter, the prices of the items changed due to the season it was. We started with buying everyday items which we knew people would be buying on a regular bases. Then we noticed that the best way to choose what items we were going to buy was looking at the profit percentage that we were going to make. We finally got the hang of it and realised that baked beans were a 200% profit and therefore, even if most of them did not sell, you would still be guaranteed a profit, but luckily for us, 90% of them sold, and we turned 45,000 pounds into 250,000. At Christmas time, it was obvious that turkeys were going to sell and therefore we put nearly all our money into them, which of course is unrealistic in real life as you wouldn’t have sold such a large amount of turkeys, but as they were selling in percentages and not in numbers, we knew we would make a lot of money.

It was very interesting and exciting to be running our ‘own shop’ and see how companies in real life have to do the same thing that we did, but of course to a more accurate and mathematical manner. They produce graphs to predict sales of certain items, using past sales and depending on the time of year which it was.
The Fibonacci Sequence

The Fibonacci sequence is a series of numbers where the next number in the series is found by adding the two previous numbers together. The series starts with 0 and 1, or sometimes with 1 and 1, and goes 0,1,1,2,3,5,8,13,21,34, and so on. The mathematical expression for this sequence is: Fn = Fn-1 + Fn-2.

This series is named after Fibonacci, also known as Leonardo of Pisa and these numbers were first introduced in his Liber abaci in 1202. Fibonacci first noted this sequence when pondering a mathematical problem about rabbit breeding. He started off with a male rabbit and a female rabbit, which would be the first two numbers. Rabbits reach sexual maturity after one month and the gestation period of a rabbit is also one month. The female rabbit gives birth to one male rabbit and one female. This then happens every month and the sequence follows for the number of rabbits. So after three months, we have a pair of sexual mature rabbits and a pair of premature sexual rabbits. After the fourth month, we have two pairs of sexual mature rabbits and a pair of premature sexual rabbits. As you can see, this well keep growing and growing just as the Fibonacci sequence does. There was one issue with Fibonacci’s sequence, and that is that the rabbits do die at some point, and he didn’t include this in his sequence.

Looking at the previous example makes Fibonacci’s sequence look unrealistic, but these numbers do appear in nature. For example, sunflower seeds are arranged in a Fibonacci spiral, keeping the seeds uniformly distributed no matter how large the seed head might be. A Fibonacci spiral is a series of connected quarter-circles drawn inside an array of squares with Fibonacci numbers for dimensions. The squares fit perfectly together because of the nature of the sequence, where the next number is equal to the sum of the two before it. Any two successive Fibonacci numbers have a ratio very close to the Golden Ratio, which is roughly 1.618034. The larger the pair of Fibonacci numbers, the closer the approximation. The spiral and resulting rectangle are known as the Golden Rectangle.

Mathematics is all around us, it may not be obvious, but it is most definitely there. We just need to look closely enough to the everyday things that we see around us and admire the beauty and mathematical concepts behind them. This can be applied while teaching mathematics to give the pupils a reason behind the learning of new math concepts which they may see as useless.

Probability. What are the chances?

Probability is the measure of the likeliness that an event will occur. Probability is quantified as a number between 0 and 1. 0 indicates that it is impossible, and 1 indicates that it is certain. We also use percentages in probability as it can be easier to understand and easier to use. The higher the probability of an event, the more certain we are that an event will occur. This is used widely in such areas of study such as mathematics, statistics, finance, gambling and even in philosophy.

There is a general equation for probability, which is: probability of an event happening is equal to the number of ways an event can occur divided by the total number of outcomes. As an example of this, the probability of a die rolling a 4 would be 1 divided by 6. This is because there is only one face on the die with the number 4 on it, and there are 6 sides on a die. So the probability of this can be shown as: 1/6, 17% or 0.17.

Even though probability gives you an exact answer, it does not mean it is certain. Probability is a guide, not exact mathematics. The best example to see this is by tossing a coin. There are two sides on a coin, therefore the chance of getting heads or tails is 50%. Therefore, if I tossed a coin 100 times, I should get heads 50 times and I should get tails 50 times. This is not correct, there is a chance of this happening, but it is unlikely. The chance is that it will be close to 50% but it is more like to not be exact.

In probability there are some words which are used which we need to know to understand what a question is asking us. Experiment or Trial mean that an action is occurring which is uncertain, for example, tossing a coin or throwing dice are experimental. Other words which we need to know are, Sample Space, which is the showing of all possible outcomes of an experiment, so if we were looking at a deck of cards, we would need all 52 possible outcomes. Sample Point is just one of the possible outcomes. Using the previous example, it would be 1 of the cards. Lastly, the word Event defines a single result of an experiment. It is different from the Sample Point due to being able to have more than one outcome, for example, choosing a King from a deck of cards, or getting an even number while rolling a dice.

With this information I can now answer a question of probability as I can interpret the question understanding what the different terms are asking me for. I also have learned the equation to answer the numerical part of the question. I now feel much more comfortable using probability and would feel happy teaching it in a classroom.

The Ishango Bone

The Ishango bone is the oldest attestation of the practice of arithmetic in human history. It was named after the place where it was found in the Democratic Republic of Congo. The Ishango bone is also called a bone tool or the cradle of mathematics. It was found in 1960 and discovered to be about twenty two thousand years old. It is a dark brown bone which happens to be the fibula of a baboon. Connected to this bone was a quartz, which is a mineral crystal, used to engrave.

The Ishango bone carries several incisions organized in groups of three columns. The left column is divided in four groups, with each group possessing 19, 17, 13 and 11 notches. These numbers sum up to 60, but that is not the interesting part. These numbers are the four successive prime numbers between 10 and 20. This constitutes a quad of prime numbers.

The central column is divided into groups of 8. This part of the bone was not very easy to read and therefore some of the groups have a minimum and a maximum number. These numbers are, 7/8, 5/7, 5/9, 10, 8/14, 4/6, 6, 3. The minimal sum of these groups is 48, while the maximal sum is 63.

The right column is divided into 4 groups, where each group has 9, 19, 21 and 11. The sum of these four numbers is 60. The same number as the left column.

At first, the Ishango bone was thought to be just a tally stick with a series of tally marks, but scientists have demonstrated that the groupings of notches on the bone are indicative of a mathematical understanding which goes beyond the simple counting. In fact, many believe that the notches follow a mathematical succession. The notches have been interpreted as a prehistoric calculator, or a lunar calendar, or a prehistoric barcode.

There is a second Ishango bone, but it has not been well studied like the first. There is not much information about this bone apart from that it has 8 groups. The first bone had also been said to track the menstrual cycle of the prehistoric women, but the second bone ruled this out and proved the bones to be a numerical source.

What is Tessellation?

What is Tessellation?

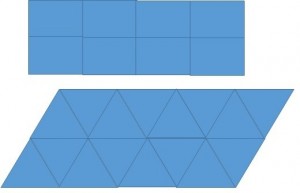
Tessellation is another word for tiling. Therefore, tessellation is when shapes are repeated over and over again covering a plane without any gaps or overlaps. There are different types of tessellation: regular, semi-regular and then other tessellations of circular, curved and irregular shapes that mathematicians agree on how to name.

Tessellation is used to look appealing to the eye, such as in art work or in peoples home, for example, tiles on walls or floors.

Below is a demonstration on how I tessellated squares and regular triangles.

Sin título

Regular polygons in a tessellation must fill the plane at each vertex, the interior angle must be an exact divisor of 360 degrees. This works for the triangle, square, and hexagon. For all the others, the interior angles are not exact divisors of 360 degrees, and therefore those figures cannot tile the plane.

Where the corners meet, they will always add up to 360 degrees. The square has a 90 degree angle and 4 squares meet in one corner, which means that you can check mathematically that they will tessellate. 90 x 4 = 360. The same works for the equilateral triangle. Each angle on a triangle is 60 degrees. In the middle of the above diagram, 6 triangles meet at one corner. It is obvious from the diagram that they tessellate but we also know mathematically by doing 60 x 6 = 360.

Stand and Deliver (ignoring the advanced calculus!)

Jaime Escalante was a business man that decided that he wanted to go back and start teaching mathematics again. The school which he got allocated to was in a deprived area with many gangs. The class that he got given was very challenging with a couple of gang members in it. As the classes went on, he attempted many different methods to engage the pupils, which is something the other teachers in the school did not do. This worked for a while, but he couldn’t stop the gang members in his class to behave. He soon changed that by making fun of them, to prove that in his class they were not superior but equal, and did not leave them out but used them to teach. In a staffroom meeting they were saying that it was impossible for the maths pupils to pass any of their exams and Jaime would not accept this. He fell out with the other members of staff to prove to them that it was possible if the hard work was put in. He spent his summer with his class in extreme heats to make sure that they would pass. He was one hundred percent dedicated from the start and it paid off. They all ended up passing the exam. Sadly, they got questioned due to who they were and had to resit the exam. They resat it and passed again, proving them wrong.

He was different to the other teachers because he did not blame the bad grades on the socio-economic background, but on the teaching. He was the only teacher in the whole school who tried his hardest to achieve the “impossible”, which ofcourse is possible. He also did not let himself get bullied by the gang members, which put him at an automatic advantage over the other teachers. One thing which I noticed, was that he did not speak to them in the correct manner which is expected from us as teachers, but spoke to them as friends and used the same slang which they did, which allowed them to feel more comfortable and easier learning environment.

I asked myself why our lecturer had given us this tutor directed task to do. After writing what happened in the film above, it became clear. It was to see a teacher who was extremely motivated and what the outcomes of that would be. Stand and Deliver showed me that to really become the best teacher I can be, i have to be as determined and motivated as I can everyday and wanting the best for my class at all times. Jaime Escalante is portraying a teacher wich I admire to and will stride to be like.

Mathematics Introduction

Maths has always been something which I have enjoyed and had an interest in. This is the first time that I have done maths outside of school, and it is looking at the subject in a different context. It is looking at how we can teach it in classrooms but also how maths is all around us, for example, in architecture, in our kitchens, in nature and much more. These are the things which I will be discussing and reflecting about in this e portfolio.