Science and maths are beginning to appear more and more within sport games.
Especially, the worlds most popular sport, football. Football is such a competitive sport and thousands of people rely on this as a career. The money factor of football increases the significant value and seriousness of the sport. Going from a range of manager’s jobs, professionals wages to the general public’s bets, millions of people rely of a games outcome. To heightening the probability of a win for a team, a manager would have to consider which players are better for certain positions in a team. To ensure which players are best for a particular team, they need to consider their strengths and weaknesses and how they could fit in the team persona. Using statistics drawn from previous matches played, we are able to see each players successful pass rate, speed/distance ran and shot conversion (and much, much more), therefore managers are able to identify the areas that need improved within their team and which players they can buy to help. Questions such as, how many corners were taken by each team? how many fouls have been given to each player? how many assists have players set up? and even a debate of who is the best player in the world? can all be settled or at least narrowed to a handful of players.
Statistics can also benefit football teams as they can provide a deeper understanding and evaluation of tactics and team performances of opposing teams. Using the data, diagrams, graphs and maps can be drawn up of how players use the pitch, as shown below.

This diagram shows the passes played by Manchester United across the pitch in one game. Each line demonstrates the direction of the pass and the length presents how short or long the shots were. The colours all how significant meaning also; Black shows that a pass is relatively common whereas white highlights less frequent passes and brown shows somewhere in between.
This data establishes that Manchester United use the wings of the pitch more often than straight through middle. This is a tactic that the opponent team would want to consider and be aware of to try defeat them.

We can use these maps to compare the different tactics used by each team. The second map on the left displays Arsenals passing during a game. I find this a good contrast to Manchester United’s passing as we can clearly see that Arsenal use shorter, more precise passing and tend to focus passes in front of the box to create chances. This is just one of the ways that mathematics can be visualised to benefit the football industry.
Match of the Day is on sky sports every Sunday evaluating and analysing all these statistics for every game in the Premier League. As the professionals critical analyse and discuss each shot, pass and tackle made, this knowledge is then pass on to the wider society. With extra insight into players ability and team tactics, the gamblers in the public, can use this information to place logical bets on predicting pretty much any move of the game. A common bet could be prediction of which players receive a foul. For example, Sergio Aguero is known for being a bit more aggressive than other players, therefore, when he is playing, betters take this likelihood into account in order to win a profit.
As well as statistics supporting predictions and increasing performance of football, the physics of the sport is also a crucially important mathematical factor. I have seen many goals disallowed as the balls hits off the cross bar and spins bouncing outside the goal line. An example of this is back in the 2010 World Cup game between England and Germany, where Frank Lampard’s shot struck against the cross bar and bounced half a metre behind the line. This raised question as to why the ball bounce outside the goal again rather than continuing into the back of the net? The University of Bath looked into the complex process of physics of why the ball spins out of the net. They studied the angle and speed at which the ball hits the crossbar and how much of a spin it put onto the ball. Experiments showed that the closer the ball was to the goal line while bouncing, the more spin it had, resulting in the ball bouncing the opposed way than expected. This is because of the horizontal velocity of the ball being reversed. This is shown in the diagram below- red line demonstrating the ball bouncing closest to the line ending up bouncing back out the goal.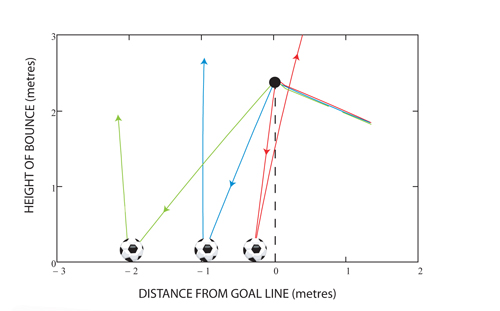
The University’s experiment also found that the surface of the ground made a difference to the spin of the ball.To read in more depth on the mathematical process of the physics of the ball- https://plus.maths.org/content/when-goal-not-goal
This type of mathematics is seen in many other sports such as basketball, netball, baseball, cricket etc. This reiterates the great Importance that mathematics makes in the industry of sport and how it impacts on the wider society. After reading into the concepts of maths within football, I have became more aware of why a manager had played a certain player in a certain position or why the ball has spun out of the net and rather than just relying on technology to figure these statistics out, it all comes down to the mathematics behind it. I also feels that I would be able to use my knowledge of statistics to teach maths to children that find football interesting to engage them and demonstrate that mathematics is EVERYWHERE!
References
https://www.fourfourtwo.com/features/soccermatics-how-maths-will-change-your-understanding-football
http://jwilson.coe.uga.edu/EMAT6680/Huffman/Mathematics%20in%20Sports/MathematicsSports.html