
| 1. 1 pt(s). |
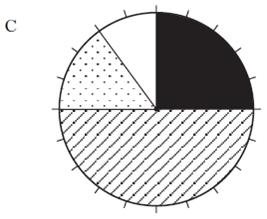
In a survey, pupils were asked how often they exercise. The results are shown in the pie chart. What percentage of pupils exercise every day?
|
||
| A. | 50% | ||
| B. | 180% | ||
| C. | 0.5% | ||
| D. | 40% | ||

| 2. 1 pt(s). |
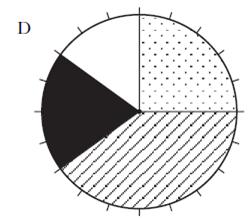
In a survey, 60 pupils were asked how often they exercise. The results are shown in the pie chart. How many pupils exercise twice a week?
|
||
| A. | 30 | ||
| B. | 25 | ||
| C. | 15 | ||
| D. | 4 | ||
| 3. 1 pt(s). |
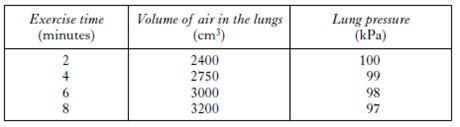
The table shows how the volume of air in the lungs and the lung pressure change during warm-up exercises. What conclusion can be drfawn from these results?
|
||
| A. | As exercise time increases, the volume of air in the lungs increases | ||
| B. | As exercise time increases, the volume of air in the lungs decreases | ||
| C. | As exercise time increases, the volume of air in the lungs stays the same | ||
| D. | As exercise time increases, the volume of air in the lungs increases then decreases | ||
| 4. 1 pt(s). |
The table shows how the volume of air in the lungs and the lung pressure change during warm-up exercises. What would the volume of air the lungs be after 3 minutes?
|
||
| A. | 2750 ml | ||
| B. | 99.5ml | ||
| C. | 2600ml | ||
| D. | 3000ml | ||
| 5. 1 pt(s). |
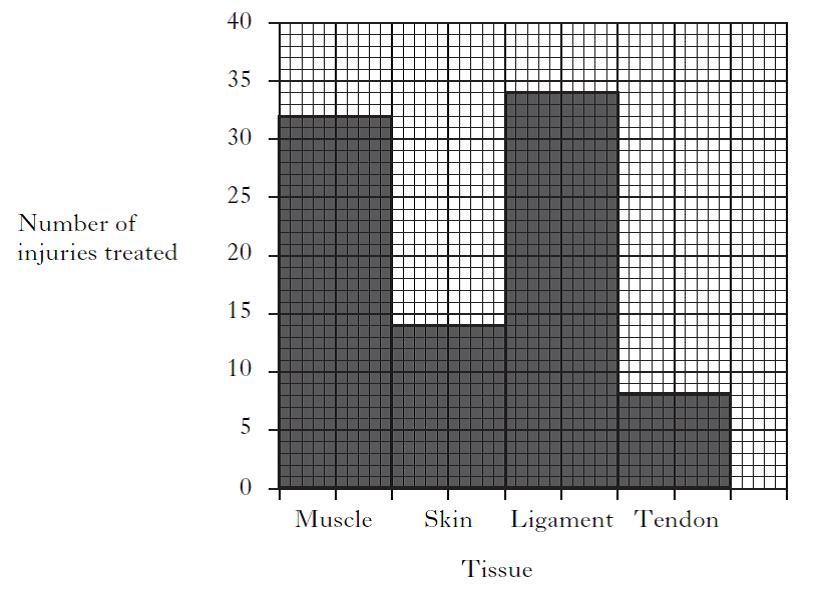
A sports injury clinic recorded the number of different tissue injuries treated in one month. The results are shown below. What is the total number of muscle and tendon injuries treated?
|
||
| A. | 40 | ||
| B. | 32 | ||
| C. | 24 | ||
| D. | 8 | ||
| 6. 1 pt(s). |
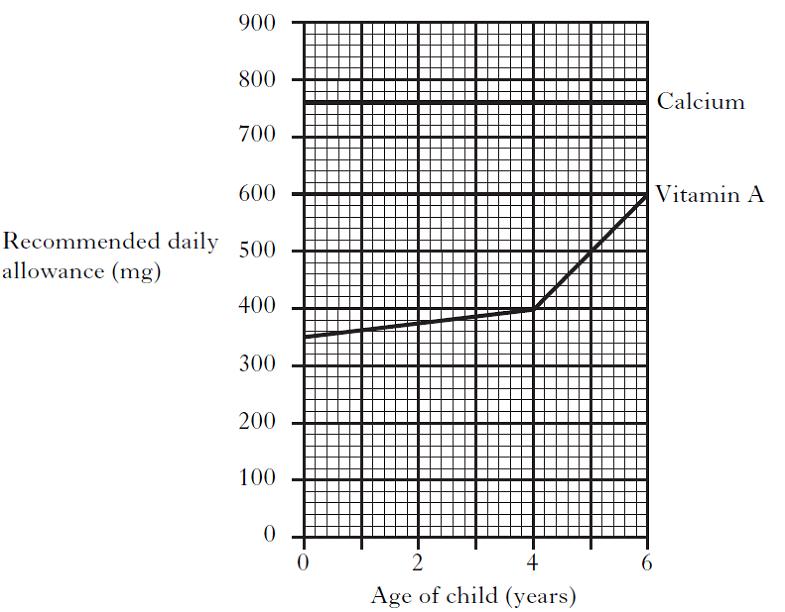
The graph below shows the recommended daily allowance of vitamin A and calcium for children of different ages. The data shows that as the age of the child increases, the recommended daily allowance of calcium
|
||
| A. | increase | ||
| B. | decreases | ||
| C. | stays the same | ||
| 7. 1 pt(s). |
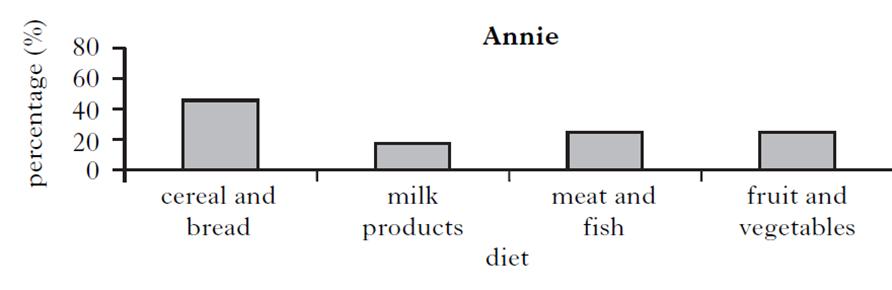
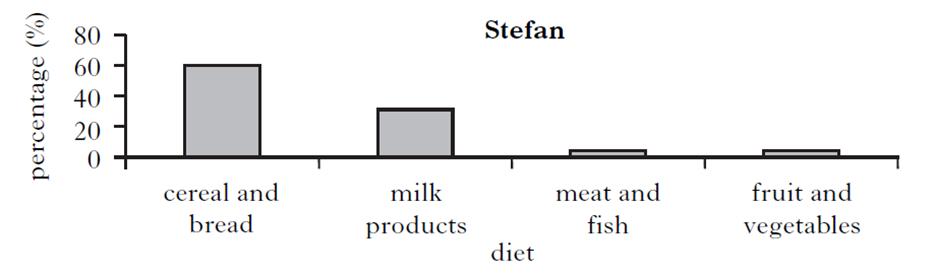
The bar graphs show information about the diets of Annie, Stefan and Misha. Which person has the most fruit and vegetables in their diet? | ||
| A. |
|
||
| B. |
|
||
| C. |
|
||

| 8. 1 pt(s). |
The bar graphs show information about the diets of Annie, Stefan and Misha. Which person has 45% cereal and bread in their diet? | ||
| A. |
|
||
| B. |
|
||
| C. |
|
||
| 9. 1 pt(s). |
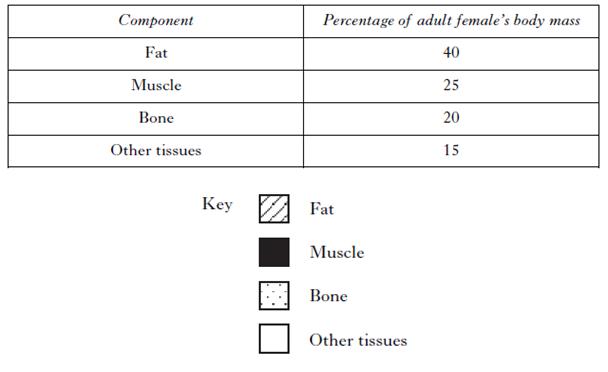
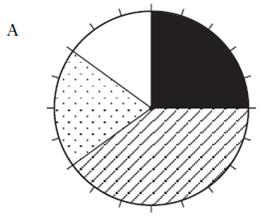
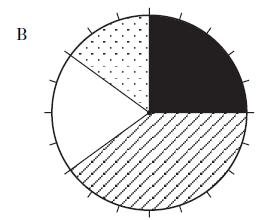
The table below shows the components which make up the body mass of an adult female. Which of the following pie charts presents this information correctly?
|
||
| A. |
|
||
| B. |
|
||
| C. |
|
||
| D. |
|
||
| 10. 1 pt(s). |
Emily ate two chocolate bars, each containing 120 calories of energy. Ben had a Big Mac meal, containing 480 caolries of energy. How much more energy had Ben consumed compared to Emily? | |
| A. | 4 calories | |
| B. | 240 calories | |
| C. | 360 calories | |
| D. | 600 calories | |