| . 1 pt(s). |
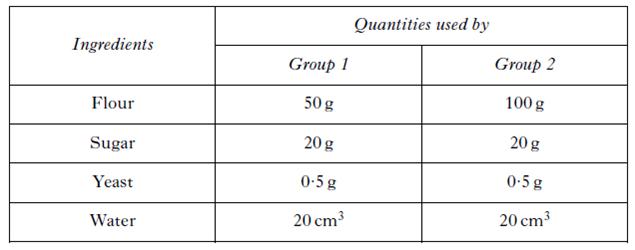
Two groups of students investigated the rising of dough using different quantities of ingredients as shown in the table below. After two hours at room temperature, both groups measured how much their dough had risen. Group 2’s dough had risen more than Group 1’s dough. Which variable caused the difference in results between Group 1 and Group 2?
|
||
| A. | Mass of flour | ||
| B. | Mass of sugar | ||
| C. | Temperature | ||
| D. | Volume of water | ||
| . 1 pt(s). |
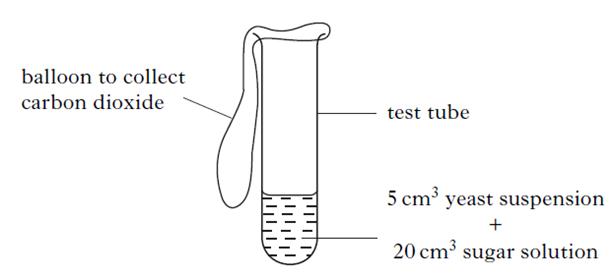
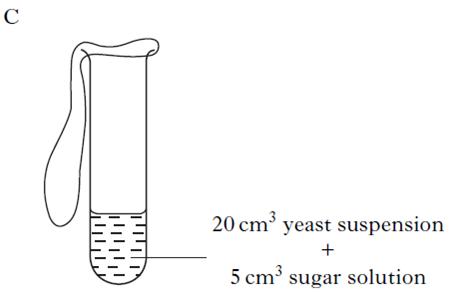
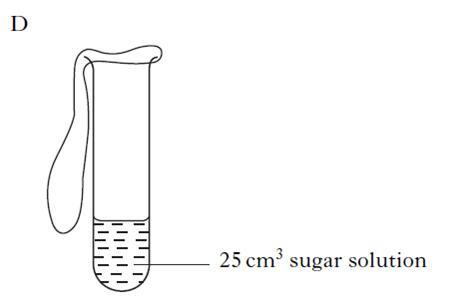
An experiment was carried out into the effect of sugar on the production of carbon dioxide during fermentation. The diagram below shows the apparatus used. Which of the diagrams below shows the control for this experiment?
|
||
| A. |
|
||
| B. |
|
||
| C. |
|
||
| D. |
|
||
| . 1 pt(s). |
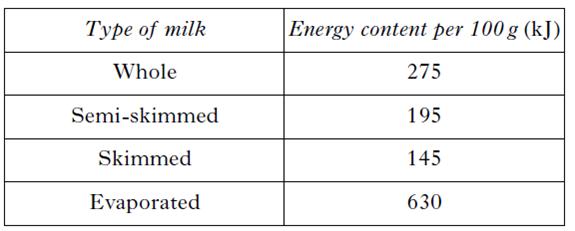
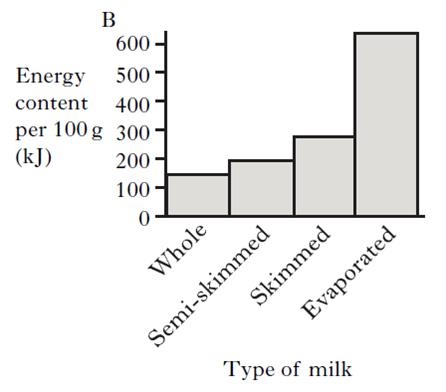
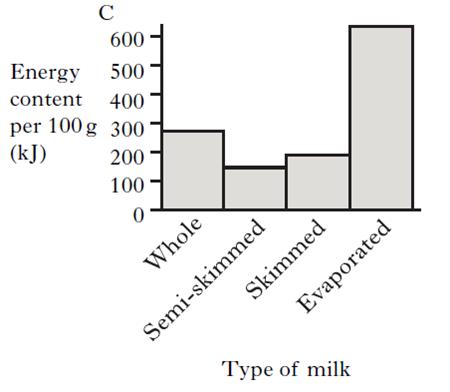
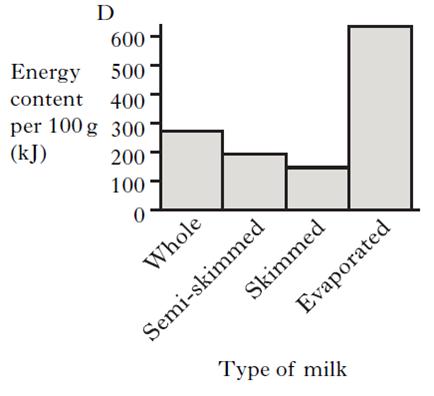
The table below shows the energy content of four types of milk. Which of the following graphs correctly represents this information?
|
||
| A. |
|
||
| B. |
|
||
| C. |
|
||
| D. |
|
||
| . 1 pt(s). |
An investigation was carried out into the effectiveness of four antifungal treatments on preventing the growth of yeast. The results are shown in the diagram below. Use the results to select the correct conclusion
|
||
| A. | All antifungal treatments are equally effective. | ||
| B. | All antifungal treatments prevent growth of all yeasts. | ||
| C. | Mycocide is most effective and Fungisan is least effective. | ||
| D. | Fungisan is most effective and Mycocide is least effective. | ||
| . 1 pt(s). |
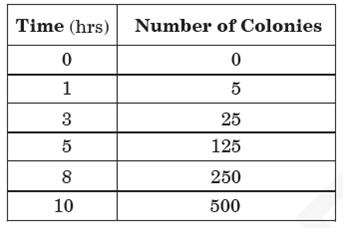
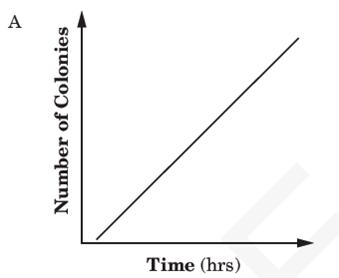
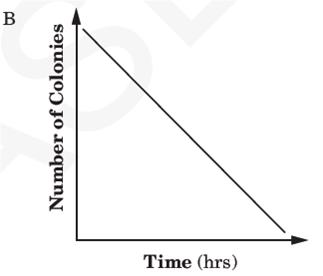
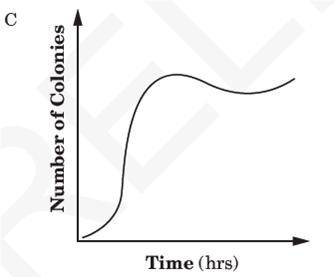
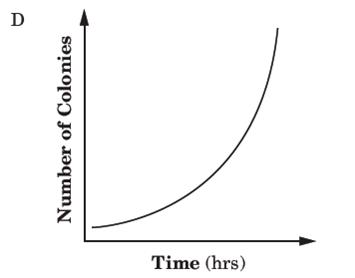
This chart shows the growth of bacteria over a period of 10 hours. Which of teh charts best represents this data?
|
||
| A. |
|
||
| B. |
|
||
| C. |
|
||
| D. |
|
||
| . 1 pt(s). |
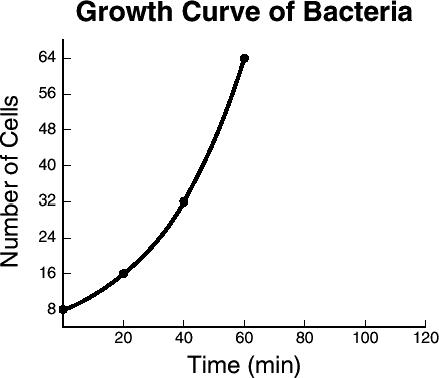
The picture shows the growth curve of a bacterial population. According to this information, the bacterial population doubles every –
|
||
| A. | 30 minutes | ||
| B. | 3 minutes | ||
| C. | 60 minutes | ||
| D. | 20 minutes | ||
| . 1 pt(s). |
Two groups of students investigated the rising of dough using different quantities of ingredients as shown in the table below. After two hours at room temperature, both groups measured how much their dough had risen. Group 2’s dough had risen more than Group 1’s dough. Which variable caused the difference in results between Group 1 and Group 2?
|
||
| A. | Mass of flour | ||
| B. | Mass of sugar | ||
| C. | Temperature | ||
| D. | Volume of water | ||
| . 1 pt(s). |
The picture below shows an antifungal cream. Which of these medical conditions can both be treated with this cream?
|
||
| A. | Anaemia and athlete’s foot | ||
| B. | Eczema and angina | ||
| C. | Thrush and anaemia | ||
| D. | Thrush and athlete’s foot | ||
| . 1 pt(s). |
Three different micro-organisms, X, Y and Z, were grown in a lab. Each micro-organism produced a different antibiotic. The mass per litre of antibiotic produced by each micro-organism is shown in the table below.
|
||
| A. | A | ||
| B. | B | ||
| C. | C | ||
| D. | D | ||


