| 1. 1 pt(s). |
The graphs below show cooling curves for 3 metal rods of the same volume and shape. A chef wants a cooking pot which will keep food hot after it has been taken off the cooker. Which metal should he use for his pot?
|
||
| A. | iron | ||
| B. | copper | ||
| C. | aluminium | ||
| 2. 1 pt(s). |
The graphs below show cooling curves for 3 metal rods of the same volume and shape. At which point on the cooling curve for copper is the rate of cooling the greatest?
|
||
| A. | A | ||
| B. | B | ||
| C. | C | ||
| D. | D | ||
| 3. 1 pt(s). |
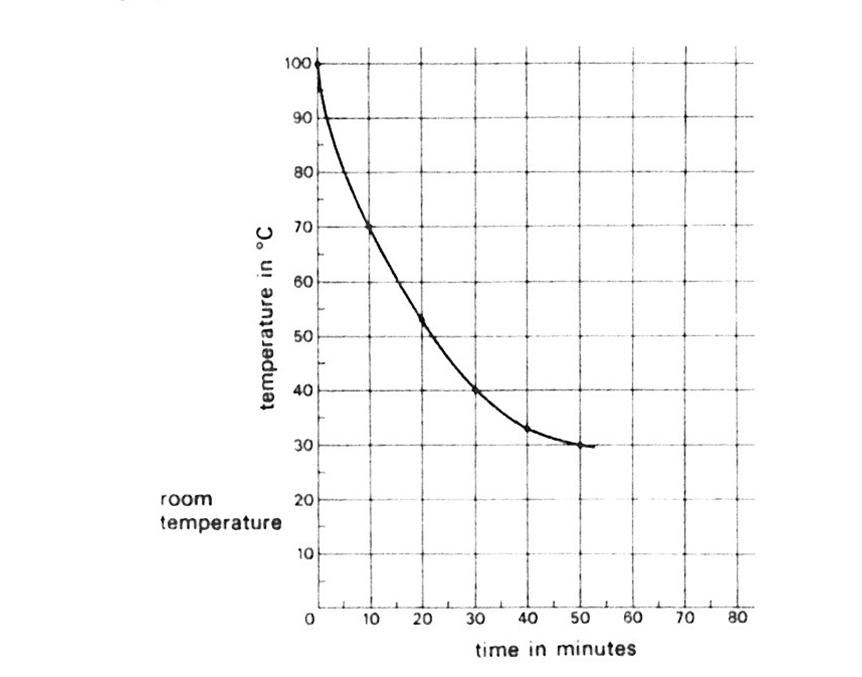
A scientist is testing an electric kettle to see how fast heat escapes in a room at 19C. He places a thermometer down the spout and boils the water. He switches off, and starts his clock at the same time. He records the temperature of the water every 10 minutes. Here are his results on a graph. The drop in temperature is biggest between the times
|
||
| A. | 0 and 10 minutes | ||
| B. | 10 and 20 minutes | ||
| C. | 20 and 30 minutes | ||
| D. | 30 and 40 minutes | ||
| 4. 1 pt(s). |
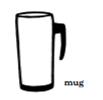
Adam investigated the cooling rate of coffee in different types of mug. The starting temperature of the coffee in each mug was 90 °C. Adam recorded the temperature of the coffee in each mug after 10 minutes. The temperatures he recorded were 88°C, 77°C, 55°C and 32°C. Adam failed to record which mug reached each temperature. Comparing the following 4 mugs below, which one would most likely to have a temperature of 55°C after 10 minutes? | ||
| A. |
|
||
| B. |
|
||
| C. |
|
||
| D. |
|
||
| 5. 1 pt(s). |
A bar of chocolate contains 540 kilojoules of energy. There are 9 squares in the bar. How many kilojoules of energy are in one square of chocolate?
|
||
| A. | 9kJ | ||
| B. | 54kJ | ||
| C. | 4860kJ | ||
| D. | 60kJ | ||
| 6. 1 pt(s). |
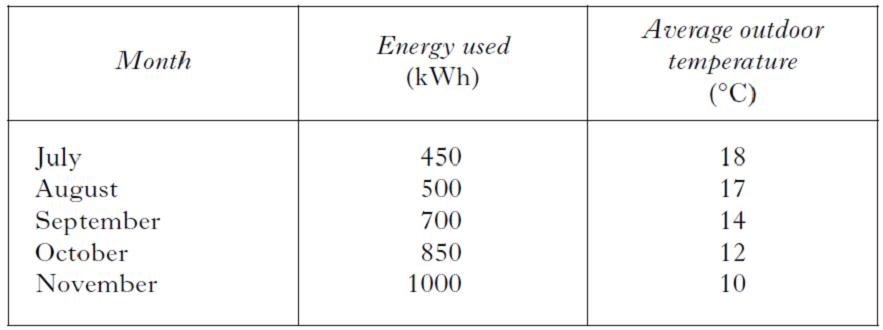
The table shows the energy used to heat a building during the months July to November. It also shows the average outdoor temperature during these months. What was the total energy used in the months when the average outdoor temperature was less than 15 ºC.
|
||
| A. | 36ºC | ||
| B. | 2550kWh | ||
| C. | 950kWh | ||
| D. | 850kWh | ||
| 7. 1 pt(s). |
The table shows the energy used to heat a building during the months July to November. It also shows the average outdoor temperature during these months. From the data it can be concluded that
|
||
| A. | As the average outdoor temperature falls, the energy used stays the same | ||
| B. | As the average outdoor temperature falls, the energy used increases | ||
| C. | As the average outdoor temperature falls, the energy used decreases | ||
| 8. 1 pt(s). |
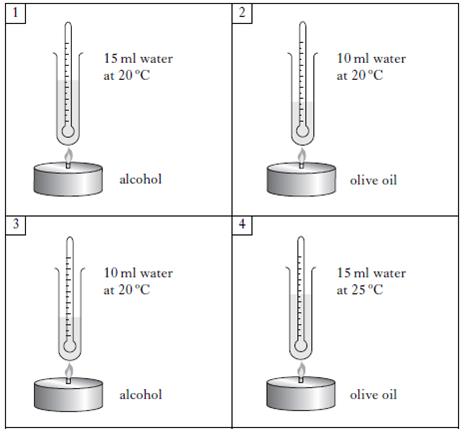
Craig investigated how quickly water could be boiled using liquid fuels. Craig wanted to find out whether alcohol or olive oil would boil the water faster. Which two boxes should he choose for a fair test?
|
||
| A. | Boxes 1 and 2 | ||
| B. | Boxes 1 and 4 | ||
| C. | Boxes 2 and 3 | ||
| D. | Boxes 3 and 4 | ||
| 9. 1 pt(s). |
Craig investigated how quickly water could be boiled using liquid fuels. Craig compared the experiments in boxes 1 and 3. What was he trying to find out?
|
||
| A. | if the volume of water affects the time taken for the water to boil | ||
| B. | if the volume of fuel affects the time taken for the water to boil | ||
| C. | if the height of the flame affects the time taken for the water to boil | ||
| D. | if having no olive oil affects the time taken for the water to boil | ||
| 10. 1 pt(s). |
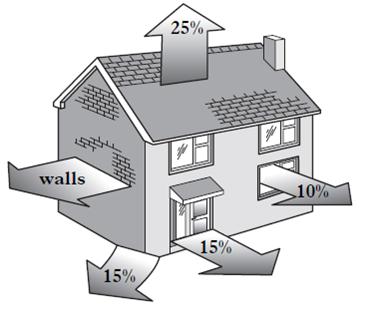
Heat energy is lost from five parts of a house as shown in the diagram below. What percentage of energy is lost through the walls?
|
||
| A. | 10% | ||
| B. | 15% | ||
| C. | 25% | ||
| D. | 35% | ||


