| 1. 1 pt(s). |
Students took samples of leaves at different heights from an oak tree and a sycamore tree. They recorded the number of caterpillars in each sample. Their results are shown in the graph. How many caterpillars were found in the leaf sample from the oak tree at a height of 15 metres?
|
||
| A. | oak tree | ||
| B. | syacamore tree | ||

| 2. 1 pt(s). |
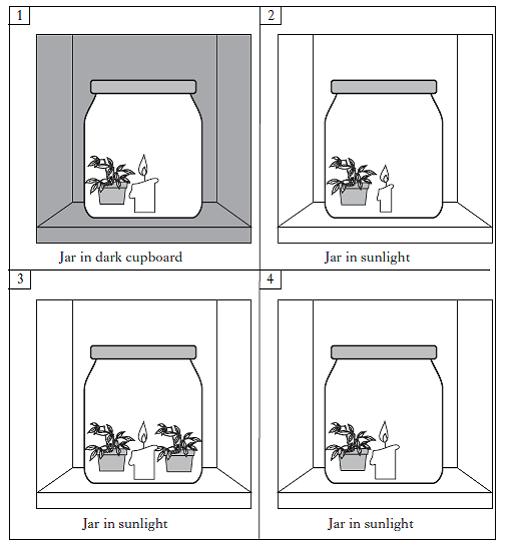
Joseph set up experiments with green plants as shown below. He lit the candles and timed how long each one burned. Joseph wanted to find out if the number of plants affects how long each candle burned. Which two boxes show the experiments he should compare for a fair test?
|
||
| A. | 1 and 3 | ||
| B. | 3 and 4 | ||
| C. | 2 and 3 | ||
| D. | 1 and 4 | ||
| 3. 1 pt(s). |
Joseph set up experiments with green plants as shown below. He lit the candles and timed how long each one burned. Joseph compared the experiments in boxes 1 and 4. What was he trying to find out?
|
||
| A. | the effect of light on the growth of the plants | ||
| B. | the effect of the number of plants on the length of time the candle burns for | ||
| C. | the effect of light on the length of time the candle burns for | ||
| D. | the effect of candle size on the length of time the candle burns for | ||
| 4. 1 pt(s). |
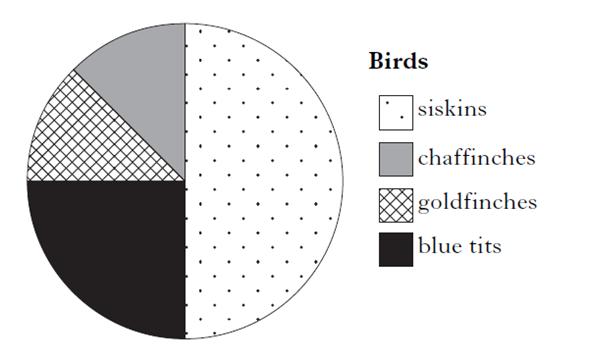
Joanne counted the numbers of different birds which visited her bird table in one hour. Her results are shown in the pie chart below. What percentage of the birds were blue tits?
|
||
| A. | 50% | ||
| B. | 25% | ||
| C. | 12.5% | ||
| D. | 90% | ||
| 5. 1 pt(s). |
Joanne counted the numbers of different birds which visited her bird table in one hour. Her results are shown in the pie chart below. 40 birds visited the table. How many were siskins?
|
||
| A. | 10 | ||
| B. | 25 | ||
| C. | 20 | ||
| D. | 10 | ||
| 6. 1 pt(s). |
Students took samples of leaves at different heights from an oak tree and a sycamore tree. They recorded the number of caterpillars in each sample. Their results are shown in the graph. How many caterpillars were found in the leaf sample from the oak tree at a height of 15 metres?
|
||
| A. | 7 | ||
| B. | 8 | ||
| C. | 9 | ||
| D. | 20 | ||
| 7. 1 pt(s). |
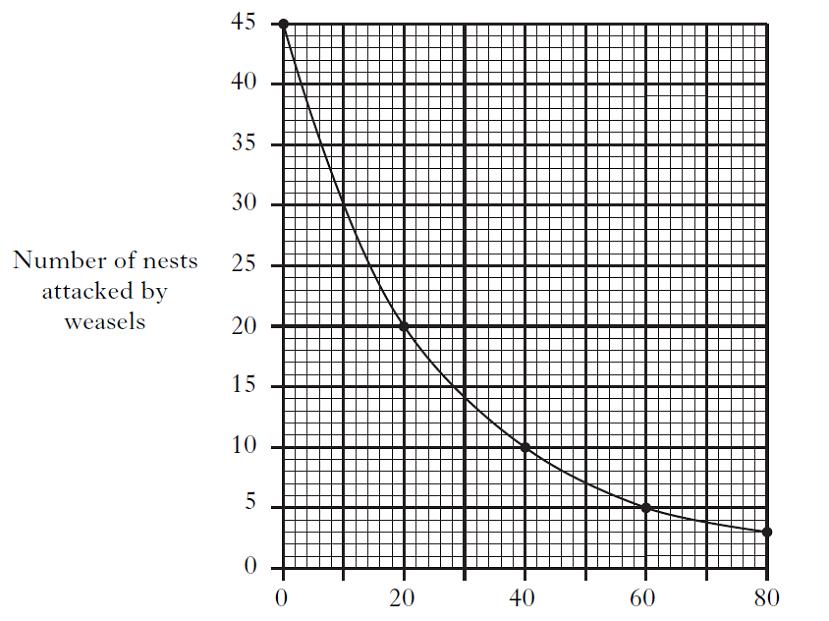
Weasels are known to attack the nests of small birds. The graph below shows how the distance between the birds’ nests affects how many are attacked by weasels. Draw one conclusion from the graph.
|
||
| A. | the more spaced the nests, the greater the risk of attack by weasels | ||
| B. | the bigger the nest, the less likely it is to be attacked | ||
| C. | weasels don’t like eggs from larger birds | ||
| D. | the closer the nests, the greater the risk of attack by weasels | ||
| 8. 1 pt(s). |
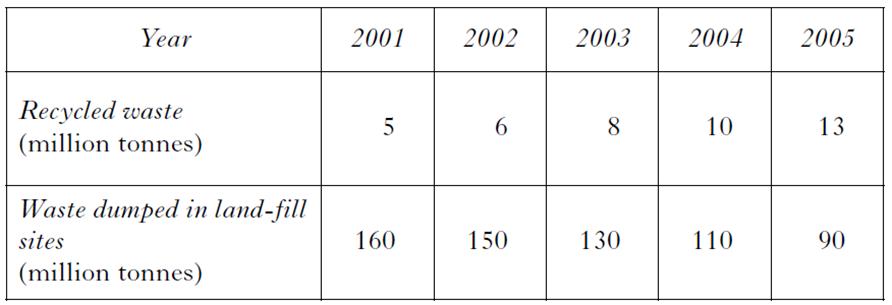
The table below shows information about recycled waste, and waste dumped in land-fill sites over a 5 year period. The data show that as the amount of recycled waste increases, the amount of waste dumped in land-fill sites
|
||
| A. | increases | ||
| B. | decreases | ||
| C. | stays the same | ||
| 9. 1 pt(s). |
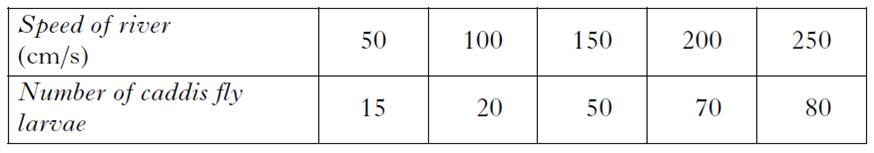
A group of students investigated the number of caddis fly larvae living in a river. They counted the number of caddis fly larvae in water samples from five points in the river. They measured the speed of the river at each point. Their results are shown in the table below. The data show that as the speed of the river increases, the number of caddis fly larvae
|
||
| A. | increases | ||
| B. | decreases | ||
| C. | stays the same | ||
| 10. 1 pt(s). |
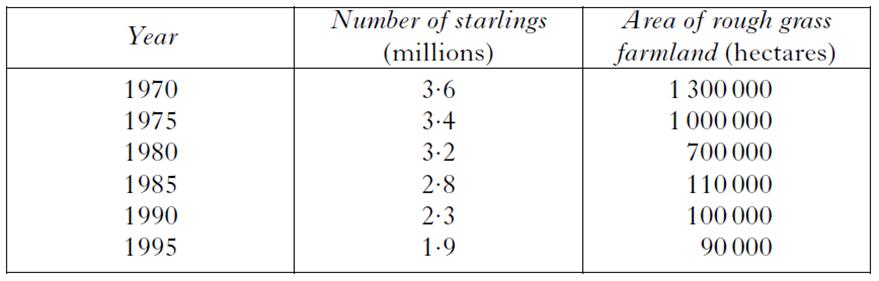
Starlings are birds which are often found living in rough grass farmland areas. The table shows how the number of starlings has changed over 25 years. Predict the number of starlings when the area of rough grass farmland was 850 000 hectares.
|
||
| A. | 1977 | ||
| B. | 3.3 | ||
| C. | 1.8 | ||
| D. | 1996 | ||