
 |
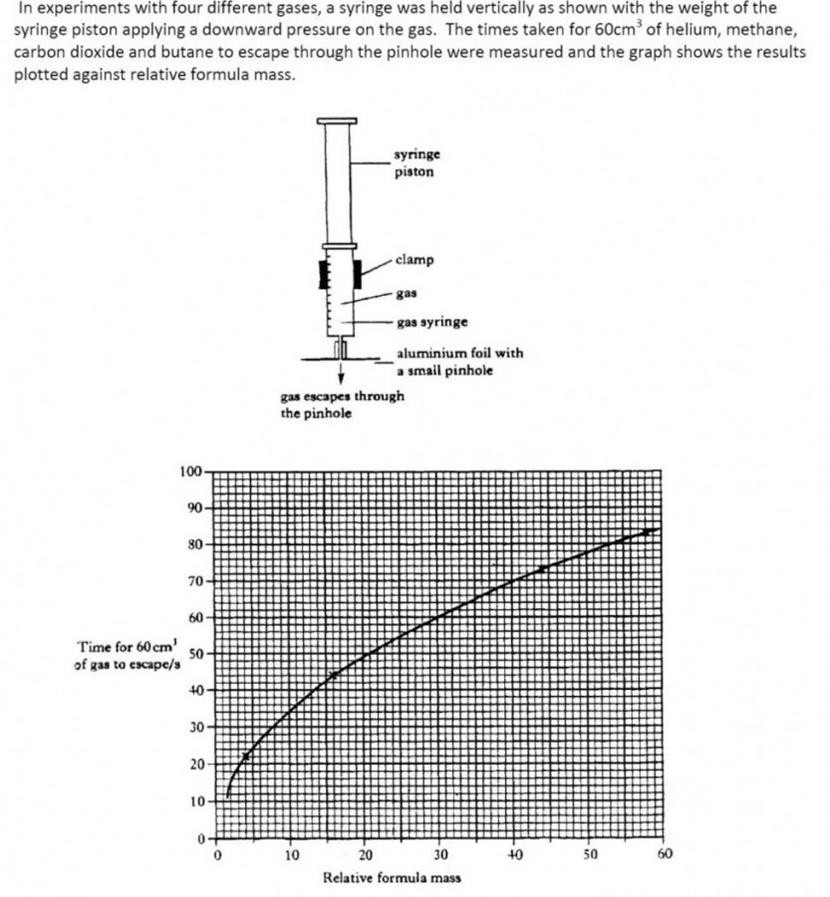
For this question, you need to read it carefully to understand the graph. The time taken for the gas to escape is plotted against the formula mass of the gas.
a) In this case the value can be read from the graph – if you know the formula mass of methane. b) The question itself is giving you a very strong hint as how to improve/ reduce the error in this measurement. The error decreases as the time increases. How could you make the measured time longer? |