HWrkSht 1_7
The Marking Guide has been made available. Use this where you are having difficulty to help you understand the question better. Simply copying the answers from the Marking Guide will not help you learn, using it to help you understand the questions/ answers will.
You will need your Glow login to access the Marking Guide.
 This Homework requires you to complete a graph on the GRAPH PAPER in your jotter. Use only a half page of graph paper for each graph. You should complete the graph on the graph sheet opposite the written answers.
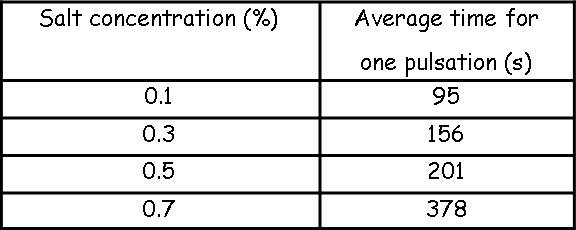
1. Euglena is a free moving freshwater unicellular organism that lives freshwater ponds. In its natural habitat, Euglena gains water by osmosis. Unwanted water is removed by the contractile vacuoles. Each filling and emptying of a contractile vacuole is called a pulsation.
In an experiment, specimens of Euglena were placed in solutions of different concentrations of salt and viewed under the microscope. The table gives the results from the observations of 7 animals.
a) Plot the data on a line graph in your jotter.
b) What is the relationship between the salt concentration of the solution and their water concentration?
c) Describe the relationship between the water concentration of the salt solution and the time taken for one pulsation? Explain why this relationship would exist.
d) Name the process that the contractile vacuoles are carrying out.
e) The experiment was repeated using solutions of pure water and 1% salt solutions. In one of these solutions the contractile vacuoles stopped working.
i. Which liquid would the contractile vacuole stop working? Explain your choice.
ii. Suggest how the contractile vacuole would respond to the other solution.
iii. What effect would this second solution have on human cheek epithelium cells?
f) Identify the variable factor in this experiment involving Euglena.
g) Name two other factors that must be kept constant in order to make the procedure valid.
h) In the experiment, why was the average value calculated for each salt concentration?
2. The table below shows the concentrations of certain ions in the cells of a type of alga and the concentrations of the same ions in the pond water in which it lives.
a) What can be said about the concentrations of the ions in the cells compared with that in the pond water?
b) What cell process has lead to the concentrations of ions in the cells?
c) Calculate the ratio of sodium ions in cell sap to that in pond water.
d) Calculate the ratio of potassium ions in cell sap to that in pond water.


