
HWrkSht 1_5
The Marking Guide has been made available. Use this where you are having difficulty to help you understand the question better. Simply copying the answers from the Marking Guide will not help you learn, using it to help you understand the questions/ answers will.
You will need your Glow login to access the Marking Guide.
 This Homework requires you to complete a graph on the GRAPH PAPER in your jotter. Use only a half page of graph paper for each graph. You should complete the graph on the graph sheet opposite the written answers.
1. Four thin sections of onion tissue were immersed in 5% sugar solution.
The sections were left for 15 minutes then viewed under a microscope.
The table below shows the percentage of cells plasmolysed in each section.
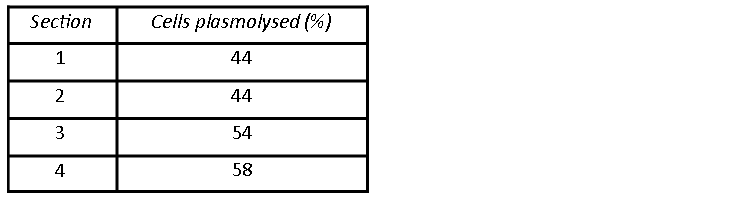
Calculate the average percentage of cells which were plasmolysed. Show your working.
2.An investigation was carried out in the effect of water concentration on the rate of osmosis.Details of the apparatus and the method used are given below.


a) Plot the data as a line graph, and complete it by joining the points.
b) Identify two variables not already mentioned that should be kept constant when setting up the investigation.
c) Explain the movement of the sugar solution in terms of water concentrations.
d) From the results, predict the distance moved by a 3.5% sugar solution in 30 minutes and justify your prediction.
3. The diagram below shows the structure of the cell membrane
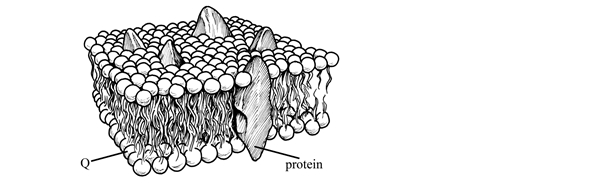
- Name molecule Q in the diagram
- Copy and complete the following sentences about the movement of water molecules across the cell membrane.
The movement of water molecules into the cell is a _____________ process and involves the molecules moving ___________ a concentration gradient. The transport of water molecules is called _______________.
4. An investigation was carried out to find the effect of salt solutions of different
concentrations on the mass of potato tissue. Five test tubes were set up as shown
below, each containing a different concentration of salt solution.
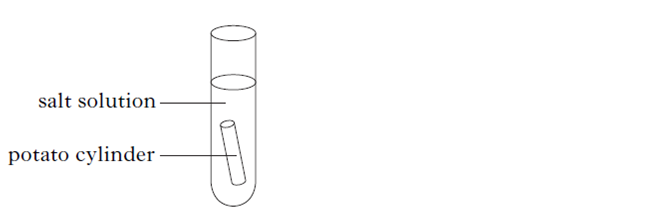
Each potato cylinder was weighed, placed in the solution and left for an hour. Each
cylinder was then reweighed and the percentage (%) change in mass was calculated.
The table below shows the results of the investigation.

a) Construct a line graph using the results given in the table.
b) Time was kept constant in this investigation.Name two other variables which must be kept constant.
c) Using the results given, state the salt concentration which is isotonic to the potato tissue. Explain your answer.
d) Predict the salt concentration that would produce a 10% decrease in mass.
4. A single celled organism is found in the water of an estuary where the salt concentration of the water is constantly changing;as the tide rises, the salt concentration increases, as the tide falls, the salt concentration decreases.The volume of the organism is observed to change with the tide.

The volume changes are due to the movement of water in and out of the organisms by osmosis.
a) When the volume of the organism was increasing in volume was the tide rising or falling in the estuary?
b) Explain your answer.