
HWrkSht 1_6
The Marking Guide has been made available. Use this where you are having difficulty to help you understand the question better. Simply copying the answers from the Marking Guide will not help you learn, using it to help you understand the questions/ answers will.
You will need your Glow login to access the Marking Guide.
 This Homework requires you to complete a graph on the GRAPH PAPER in your jotter. Use only a half page of graph paper for each graph. You should complete the graph on the graph sheet opposite the written answers.
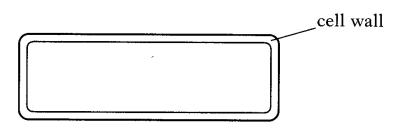
1.A flower petal was examined under the microscope and then placed in a concentrated salt solution for 30 minutes.It was then re-examined under the microscope.
The diagrams below show a cell from the petal before and after being in the solution.

a) The movement of water caused the change in the appearance of the cell.What name is given to this movement of water?
b) In terms of water concentration, explain why this movement of water took place.
c) Name one substance, other than water that must be able to pass into a cell for its survival.
2)The concentration of some substances inside and outside three cells is shown in the diagrams below.

a) Identify the cell(s) in which diffusion of the substance into the cell would occur.
b) Identify the cell(s) in which osmosis would occur
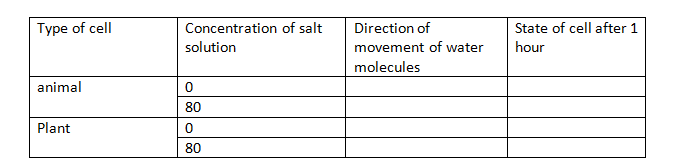
3) Tissue samples from both animal and plant cells were placed in varying concentrations of salt solution.
copy and complete the table giving the state of each cell after being immersed for one hour.
4.A student cut five similar cylinders from the same potato, dried them with a paper
towel and weighed them.
Each cylinder was placed in a different concentration of sugar solution as shown in
the diagram below:

After three hours, the student removed the cylinders from the solutions, dried and
weighed them as before.
The results are shown in the table below.

a) Calculate the percentage change in mass of the potato cylinder in 0.4M sugar solution.
b) Name the variable altered in this investigation.
c) Suggest one way in which the reliability of the results could be improved.
d) Would the results be valid if the cylinders were not dried before being weighed?Explain your answer.
e) State the letter of one test tube containing a potato cylinder in a hypertonic solution.
f) Describe how the potato cylinder in test tube E would feel after three hours.
g) Construct a line graph of the data.
h) From your graph, what concentration of sugar solution would be isotonic with the potato cell contents?
