| 1. | Which of the following stages in respiration would result in the production of no molecules of ATP? | |
| A. | Glucose to pyruvic acid | |
| B. | Pyruvic acid to lactic acid | |
| C. | Pyruvic acid to carbon dioxide and water | |
| D. | Glucose to carbon dioxide and water | |
| 2. | Which of the following stages in respiration would result in the production of 2 molecules of ATP? | |
| A. | Glucose to pyruvic acid | |
| B. | Pyruvic acid to lactic acid | |
| C. | Pyruvic acid to carbon dioxide and water | |
| D. | Glucose to carbon dioxide and water | |
| 3. | Which change represents the way in which ATP is produced during anaerobic respiration in cells? | |
| A. | ADP + energy → ATP + Pi | |
| B. | ADP + Pi + energy → ATP | |
| C. | ADP + Pi → ATP | |
| D. | ADP + Pi → ATP + energy | |
| 4. | Which change represents the way in which ATP is broken down in cells? | |
| A. | ATP → ADP + Pi + energy | |
| B. | ATP + energy → ADP + Pi | |
| C. | ATP + Pi → ADP + energy | |
| D. | ATP → ADP + Pi | |
| 5. | The energy for the formation of ATP during anerobic respiration in cells comes from | |
| A. | ADP | |
| B. | glucose | |
| C. | inroganic phosphate | |
| D. | enzymes | |
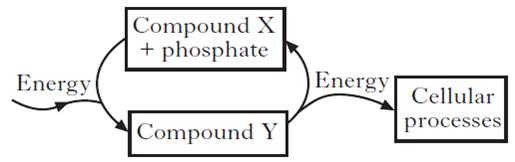
| 6. | The diagram below shows energy transfer within a cell. Compound Y would be
|
||
| A. | ATP | ||
| B. | Glucose | ||
| C. | carbon dioxide | ||
| D. | ADP | ||
| 7. | The energy yield per glucose molecule during anaerobic respiration is | |
| A. | 2 molecules of ATP | |
| B. | 18 molecules of ATP | |
| C. | 36 molecules of ATP | |
| D. | 38 molecules of ATP | |
| 8. | The anaerobic breakdown of glucose splits from the aerobic pathway of respiration | |
| A. | after the formation of pyruvic acid | |
| B. | at the start of the breakdown of glucose | |
| C. | after carbon dioixde and water has been produced | |
| D. | after the formation of lactic acid | |
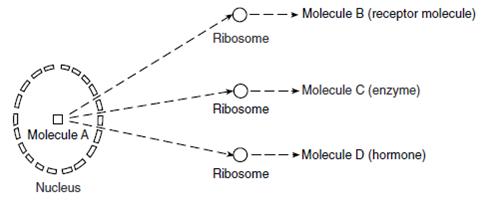
| 9. | Examine the diagram below, which represents a sequence of events in a biological process that occurs within human cells. Molecules B, C, and D are similar in that they are usually
|
||
| A. | composed of genetic information | ||
| B. | involved in the synthesis of antibiotics | ||
| C. | composed of amino acids | ||
| D. | involved in the diffusion of oxygen into the cell | ||
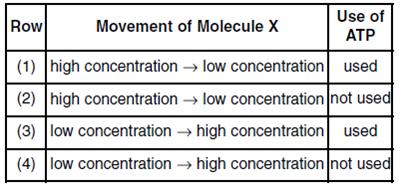
| 10. | Molecule X moves across a cell membrane by diffusion. Which row in the chart below best indicates the relationship between the relative concentrations of molecule X and the use of ATP in Active Transport?
|
||
| A. | 1 | ||
| B. | 2 | ||
| C. | 3 | ||
| D. | 4 | ||
| 11. | Which row in the chart below contains correct information concerning synthesis?
|
||
| A. | 1 | ||
| B. | 2 | ||
| C. | 3 | ||
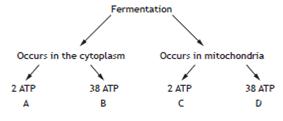
| D. | 4 | ||

| 12. | Which of the following shows the correct location and number of ATP molecules released from a molecule of glucose during fermentation?
|
||
| A. | A | ||
| B. | B | ||
| C. | C | ||
| D. | D | ||