| . 1 pts. |
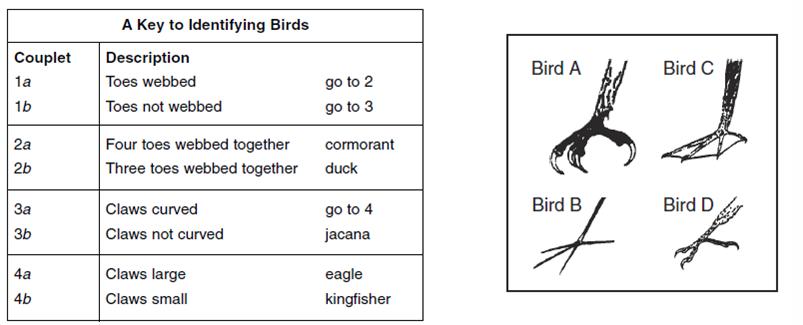
Using the key, bird B is correctly identified as
|
||
| A. | a cormorant | ||
| B. | a duck | ||
| C. | an eagle | ||
| D. | a jacana | ||
| . 1 pts. |
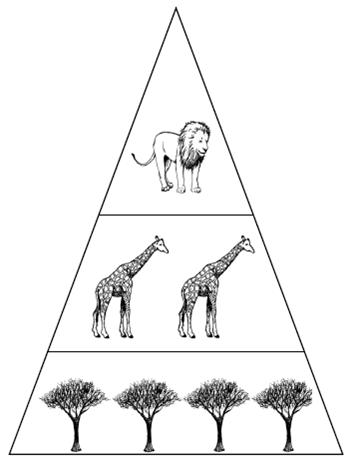
The diagram shows a pyramid of biomass. Which of these best describes a relationship shown by this African pyramid of biomass?
|
||
| A. | The lion is a predator of the giraffes. | ||
| B. | The lion is the prey of the giraffes. | ||
| C. | Giraffes are the prey of the trees. | ||
| D. | Giraffes are predators of the lion. | ||
| . 1 pts. |
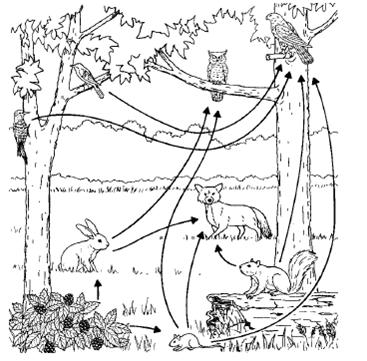
Which of the organisms in a forest ecosystem is an example of a producer? | |
| A. | squirrels | |
| B. | oak trees | |
| C. | black bear | |
| D. | bacteria | |
| . 1 pts. |
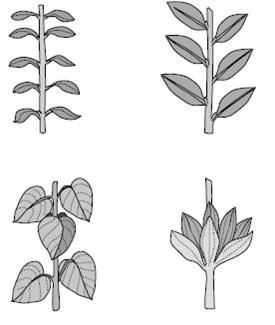
Botanists often use leaves to identify plants. Which trait of the leaves shown would be most useful in identifying the plants they came from?
|
||
| A. | Colour of the leaf | ||
| B. | Function of the leaf | ||
| C. | Arrangement of leaves on a stem | ||
| D. | Presence or absence of veins | ||
| . 1 pts. |
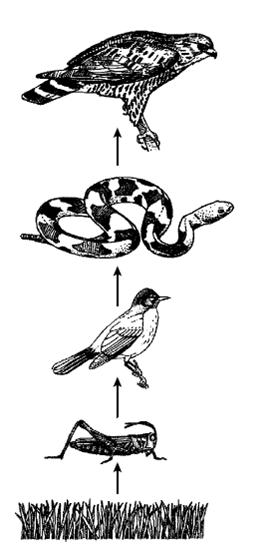
In a food chain, the numbers of each type of population are usually in a relatively stable combination. A diagram of a food chain is shown above. If humans interfered by spraying an insecticide to kill the insects, what would be the next thing that would happen?
|
||
| A. | The number of hawks would increase | ||
| B. | The number of small songbirds would decrease | ||
| C. | The number of grass plants would decrease | ||
| D. | The number of snakes would increase | ||
| . 1 pts. |
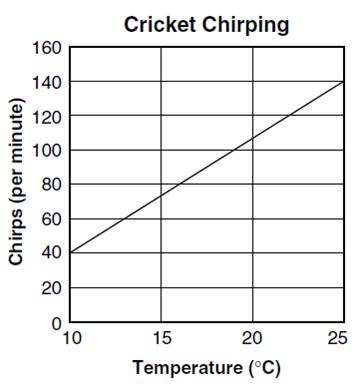
Crickets chirp to attract other crickets. The temperatures and rates of their chirping are graphed above. Which statement below is most likely true for the data represented in the graph?
|
||
| A. | The cooler the temperature, the louder the crickets chirp. | ||
| B. | The crickets cannot chirp at temperatures lower than 10C | ||
| C. | The warmer the temperature, the more often crickets chirp. | ||
| D. | The temperature and the chirping of crickets are not related | ||
| . 1 pts. |
Which of these could cause a decrease in the number of squirrels in a population? | |
| A. | An increase in cooperation with birds in the area | |
| B. | An increase in the squirrels’ territory | |
| C. | An increase in competition with other nut-eating animals | |
| D. | An increase in the squirrels’ food supply | |
| . 1 pts. |
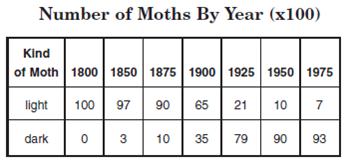
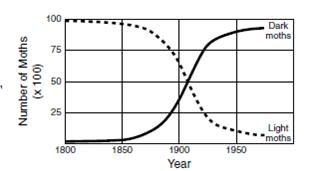
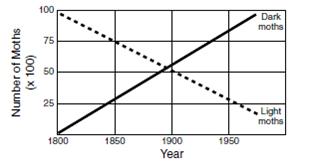
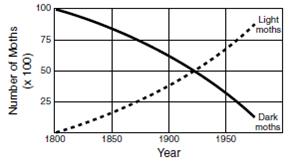
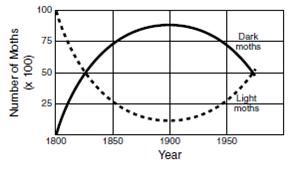
Scientists have spent many years studying the peppered moth, which is a species that has adapted its color from light to dark in reaction to environmental pollution. Which of the following line graphs represents the data from the table?
|
||
| A. |
|
||
| B. |
|
||
| C. |
|
||
| D. |
|
||
| . 1 pts. |
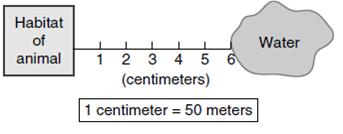
The picture above illustrates the habitat of a population of animals and its distance from the nearest water source. How far does an animal have to travel to obtain water?
|
||
| A. | 6 centimeters | ||
| B. | 12 metres | ||
| C. | 50 metres | ||
| D. | 300 metres | ||
| . 1 pts. |
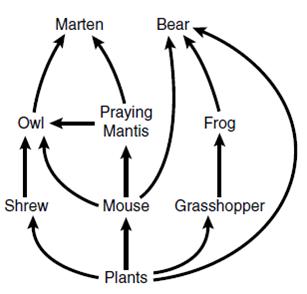
Which of these populations is most likely to increase if the number of grasshoppers decreases?
|
||
| A. | Plant | ||
| B. | Frog | ||
| C. | Praying mantis | ||
| D. | Owl | ||
| . 1 pts. |
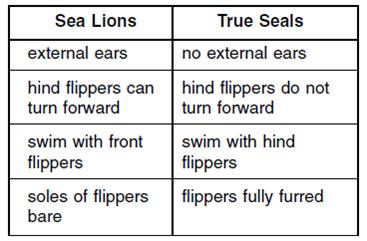
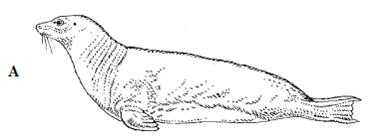
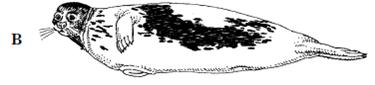
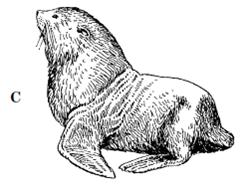
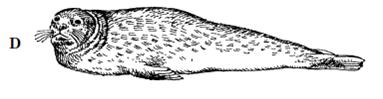
According to this chart, which of these animals is a sea lion?
|
||
| A. |
|
||
| B. |
|
||
| C. |
|
||
| D. |
|
||
| . 1 pts. |
The relationship between the algae and the frog may be described as —
|
||
| A. | consumer → producer | ||
| B. | consumer → decomposer | ||
| C. | producer → consumer | ||
| D. | producer → decomposer | ||
| . 1 pts. |
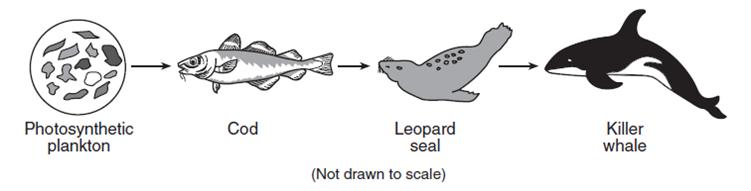
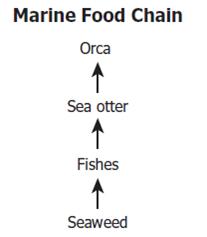
What is the role of the Orca in this food chain?
|
||
| A. | producer | ||
| B. | primary consumer | ||
| C. | secondary consumer | ||
| D. | tertiary consumer | ||
| . 1 pts. |
In the food web shown, which of the following consumers eats only producers?
|
||
| A. | Hawk | ||
| B. | Owl | ||
| C. | Fox | ||
| D. | Mouse | ||