All posts by Mr Jones

SQA Update Project Marking Scheme

You might have noticed that the SQA have announced updates to the detailed marking instructions for the Higher Applications of Maths Project. Here I’ll point out what has changed and give some thoughts. The main thrust of the change is make things clearer for students who are working with categorical data, and I think the changes will be welcomed by teachers.

Subjective Impression

There are three changes here. The first concerns the graphical displays to be produced:

SQA course spec
New, old

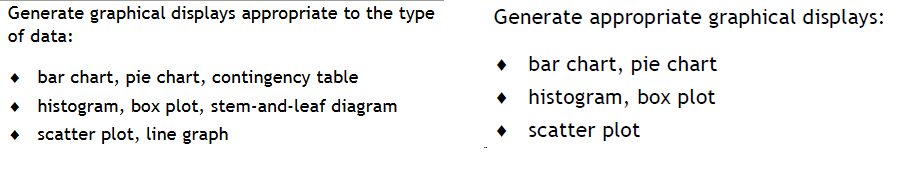
Here they clarify that a contingency table counts as a graphical display, and also suggest that a line graph can be used the achieve the second mark when studying bivariate data.

A significant change is the inclusion of proportion and sample size:

New above, old below

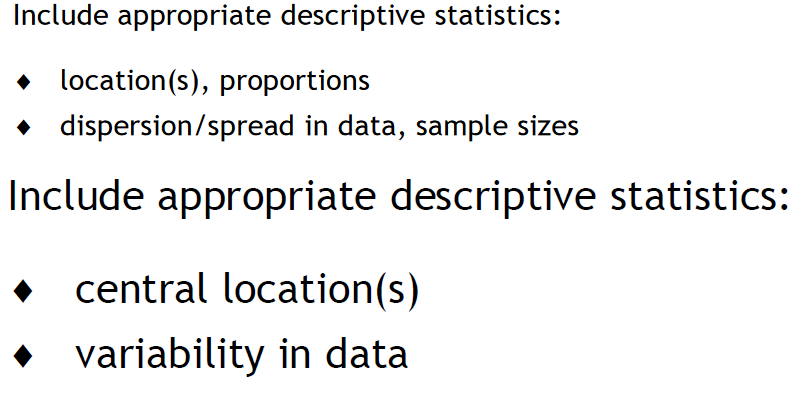
Let me make this clear: If you are writing a project about categorical data, then include information about your proportions and state your sample size!

The final change for the subjective impression is replacing “variability” to “dispersion/spread”, which better matches the course spec.

Analysis and Interpretation

Instead of saying “Perform appropriate tests and present additional statistical information” for two marks, it has changed to make where marks come from much clearer. You now get one mark for making the appropriate choice of test, and then one mark for correctly generating output for that test.

I’ll share an example to explain how I’m taking this. Student A is comparing two means, and decides to do cor.test in R. Student A types cor.test into R and generates a p-value and states the regression line. Student A would fail to get mark 1 (she’s done the wrong test) but would get mark 2 (she’s demonstrated she is able to generate an output for the test she has said she will do). Student A does not lose two marks for making one mistake.

Another change is the inclusion of “comparing proportions” under “descriptive statistics”. This again is about clearing up where marks can appear for categorical data. If you are writing a project on categorical data, state the proportions and make a comparison as part of the analysis.

Presentation

The change in wording is small, but it’s a really significant one: “Include bibliography AND appendix of data” (my emphasis!). Before it was “or” rather than “and”.  Students must include an appendix. Being realistic, if the dataset used is massive, then include 10 or so rows as an appendix and give details on how to find the full set. But the appendix has to be there.

This is for the benefit of markers, who will want to see some of the data to try and get to grips with what the students were attempting to do. This should also benefit students as it might make some of their projects a little more intelligible.

Bryn

Scheme of Learning

I’ve finally got around to publishing a course plan for Higher Apps next year (which can be downloaded here).

I want to share some rationale behind the order of the topics.

Last year, I taught the course in the following order: Statistics, Finance, Planning and then Modelling. The rationale for that was fairly simple- I taught topics I felt the most confident teaching first, to maximise the time I had to get to grips with the rest.

But one of my biggest takeaways from teaching the course this year is that Modelling really underpins everything. Sampling in statistics is a model, and hypothesis testing is a way of evaluating that model. Finance heavily uses recurrence relations, and PERT and Gannt charts again follow the theme of representing something complex as a simplified model. In a conference, a speaker from the SQA suggested this was why Modelling was the first part of the SQA specification, and it’s why I’ve put it front and centre.

Not all the students taking Higher Apps at my school will have come from National 5 Apps, some will have only studied National 5 Maths. I’ve tried to identify the key bits of prerequisite knowledge students need and placed them in the June period. Precedence tables are probably the clearest example of something students not studying Apps will have missed, along with tolerance and probability (though likely covered in BGE phase).  Volume, gradient and converting units of measure will be important in the early part of mathematical modelling.

At the end of the Modelling section is spreadsheet skills. I’ll share more ideas on teaching this nearer the time, but this section can be used as a sneak preview for the rest of the course. Many of the spreadsheet skills required are statistical ones, or implementing recurrence relations, which foreshadow much of what is to come.

I decided to put Statistics second to give a bit of distance between the project and the exam. With students having to learn R Studio, it makes sense to get them using the new program early on into the course. I’ve given two weeks for the project.

Finance is the biggest section on the test. It’s also the topic that my students found to be the easiest of the whole course. Accumulation and present value feel like small extensions of appreciation and reverse percentage, the main barrier is getting used to using spreadsheets to implement the calculations.

Planning comes last. Last year, we covered PERT and Gannt charts in one week and the students were very confident with them.

I’ve also included the approximate date that the pre-release material will be released. This seemed to catch a few people off guard this year- it is worth putting a week to one side in your schemes of learning just for the pre-release. As we found out this year, the pre-release material can be meaty!

Happy Apping!