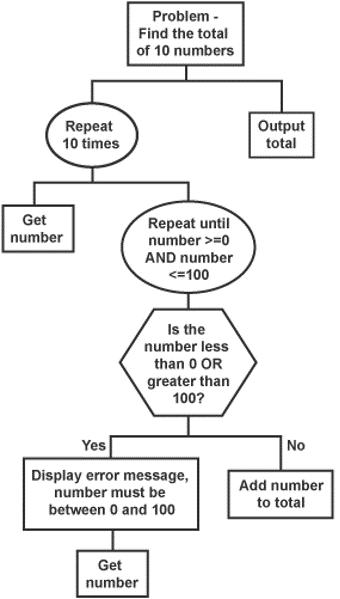
A structure diagram is useful to show the flow of data in and out of modules. To read a structure diagram you start on the left most of each level and go downwards when possible.
# Program to find the total of 10 numbers

total = 0
for counter in range(10):
    number = int(input("Please enter a number between 0 and 100 "))
    while True:
        if number >= 0 and number <= 100:
            total += number
            break;
        else:
            print("Number must be between 0 and 100")
            number = int(input("Please enter a number between 0 and 100 "))

print("Total: " + str(total))
So in the above diagram, you complete everything under the “Repeat 10 times” branch of the tree before going to the “Output total” branch.

Used to show that a process is needed. This will need code during implementation.
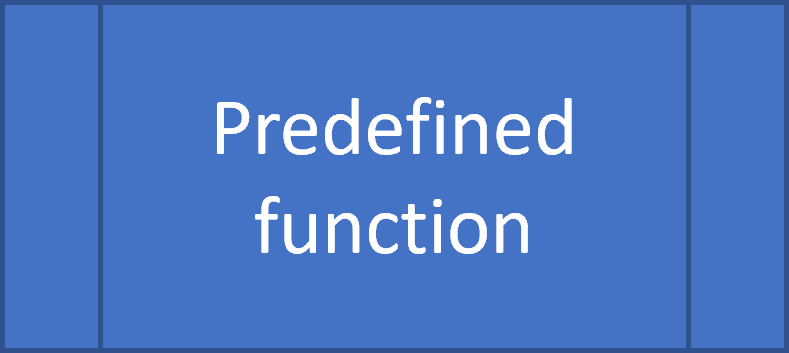
A function defined in another structure diagram or using a built in system function that does not require additional code.
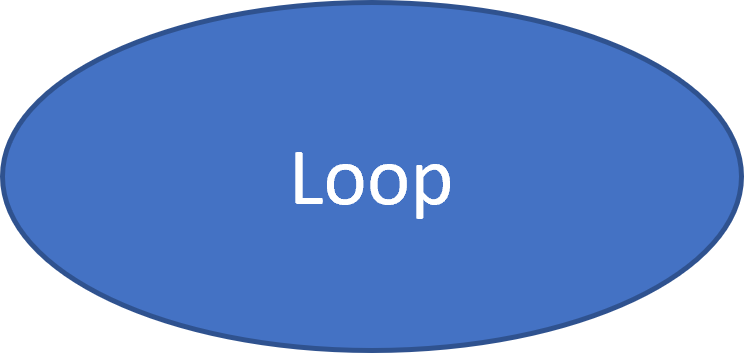
Used to show repetition or iteration. The programmer will need to code the looping structure during implementation.
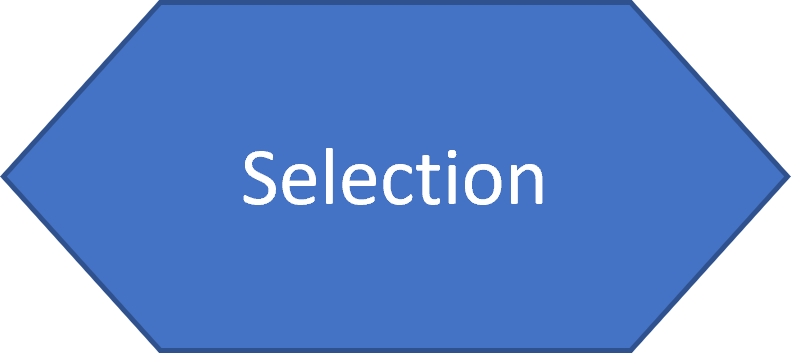
Used to show there are different outcomes from this point. The programmer will need to code in conditional statements such as if or else.